


Marching to the Beat, into the valley of Death

August was a crazy month for the markets. It had absolutely everything in it, from the utter horror of the Nikkei index falling double-digits in a single day to the euphoria at the end of the month, with a wild ride in between.
Market commentators are back in business, and the markets are at an ATH, perplexing both bulls and bears. Promoters are selling like the markets won’t exist tomorrow (Only 20K Crore in the past week), and the stocks are rising after promoters’ sales. Much traditional market wisdom is falling to the relentless assault of liquidity. Everyone is waiting for the elusive correction (including yours truly), but the inevitable march to newer and newer ATHs continues unabated under this liquidity juggernaut (unless the stock is HDFC Bank or Reliance - and I hold both of them)
The Story of August 2024
Do you recall the utter panic and awe at the moves in the Nikkei from the start of the month? Do you remember the US VIX shot up to the mid-60s and then crashed back to earth?
Despite that, NIFTY closed in August at a new ATH of 25235.95 with a range of just 5.49% (23893 - 25268), and in the green (i.e. close > open). This was also the 10th consecutive month of higher highs on the NIFTY.
NIFTY ended the month with two points of fundamental dissonance. 30 August 2024 set a new record with the 12th consecutive day of a higher close than the previous day and the narrowest range from the past 70 trading days. The NIFTY did this on a full working day, last on 5 June 2023.
A couple of other points to note:
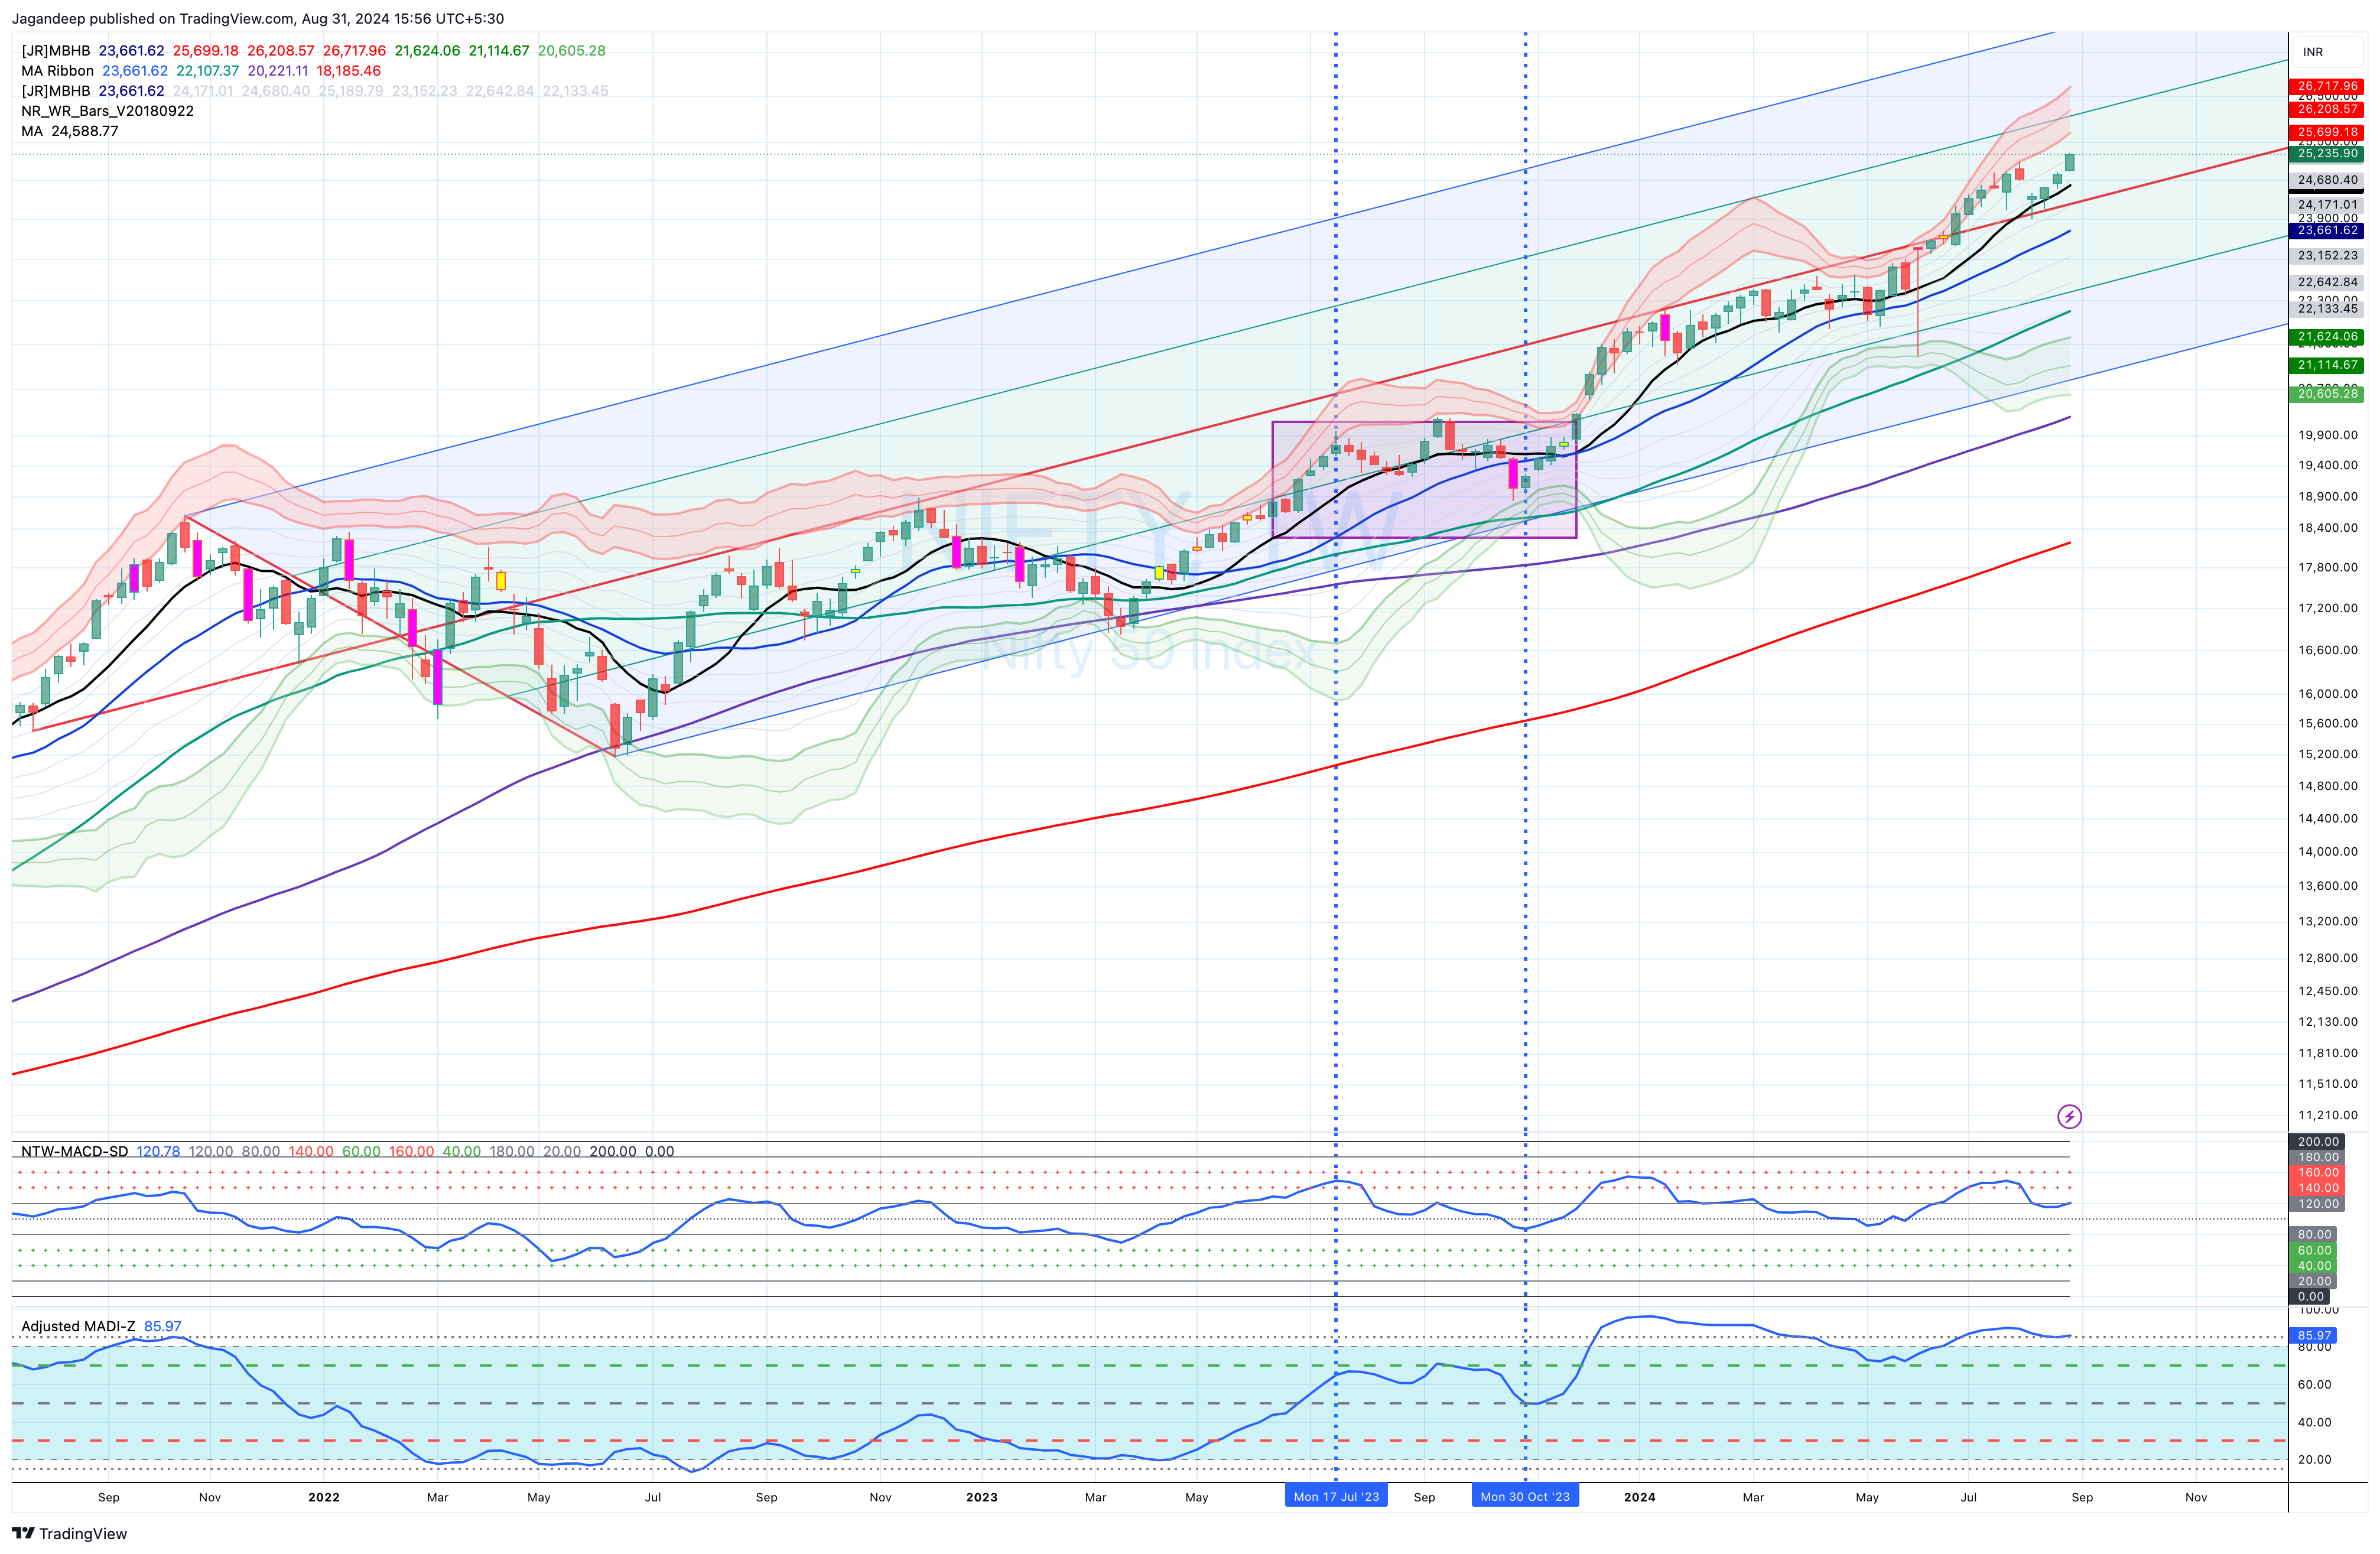
During August, NIFTY pulled back to
The 50D-SMA (SMA is Simple Moving Average),
The middle line of the pitchfork,
Closed below the 20D-SMA and
pulled back enough to get the 10 D-SMA to complete its cycle with a crossover and then a reversal above the 20D-SMA.
In the last correction, NIFTY made two back-to-back downside gaps and took them out in the ensuing rally.
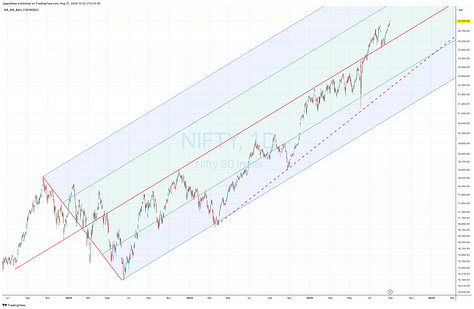
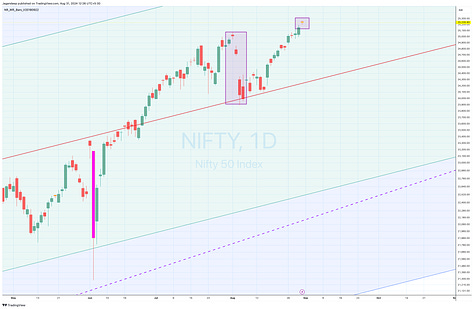
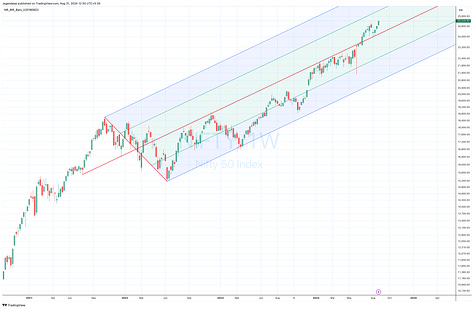
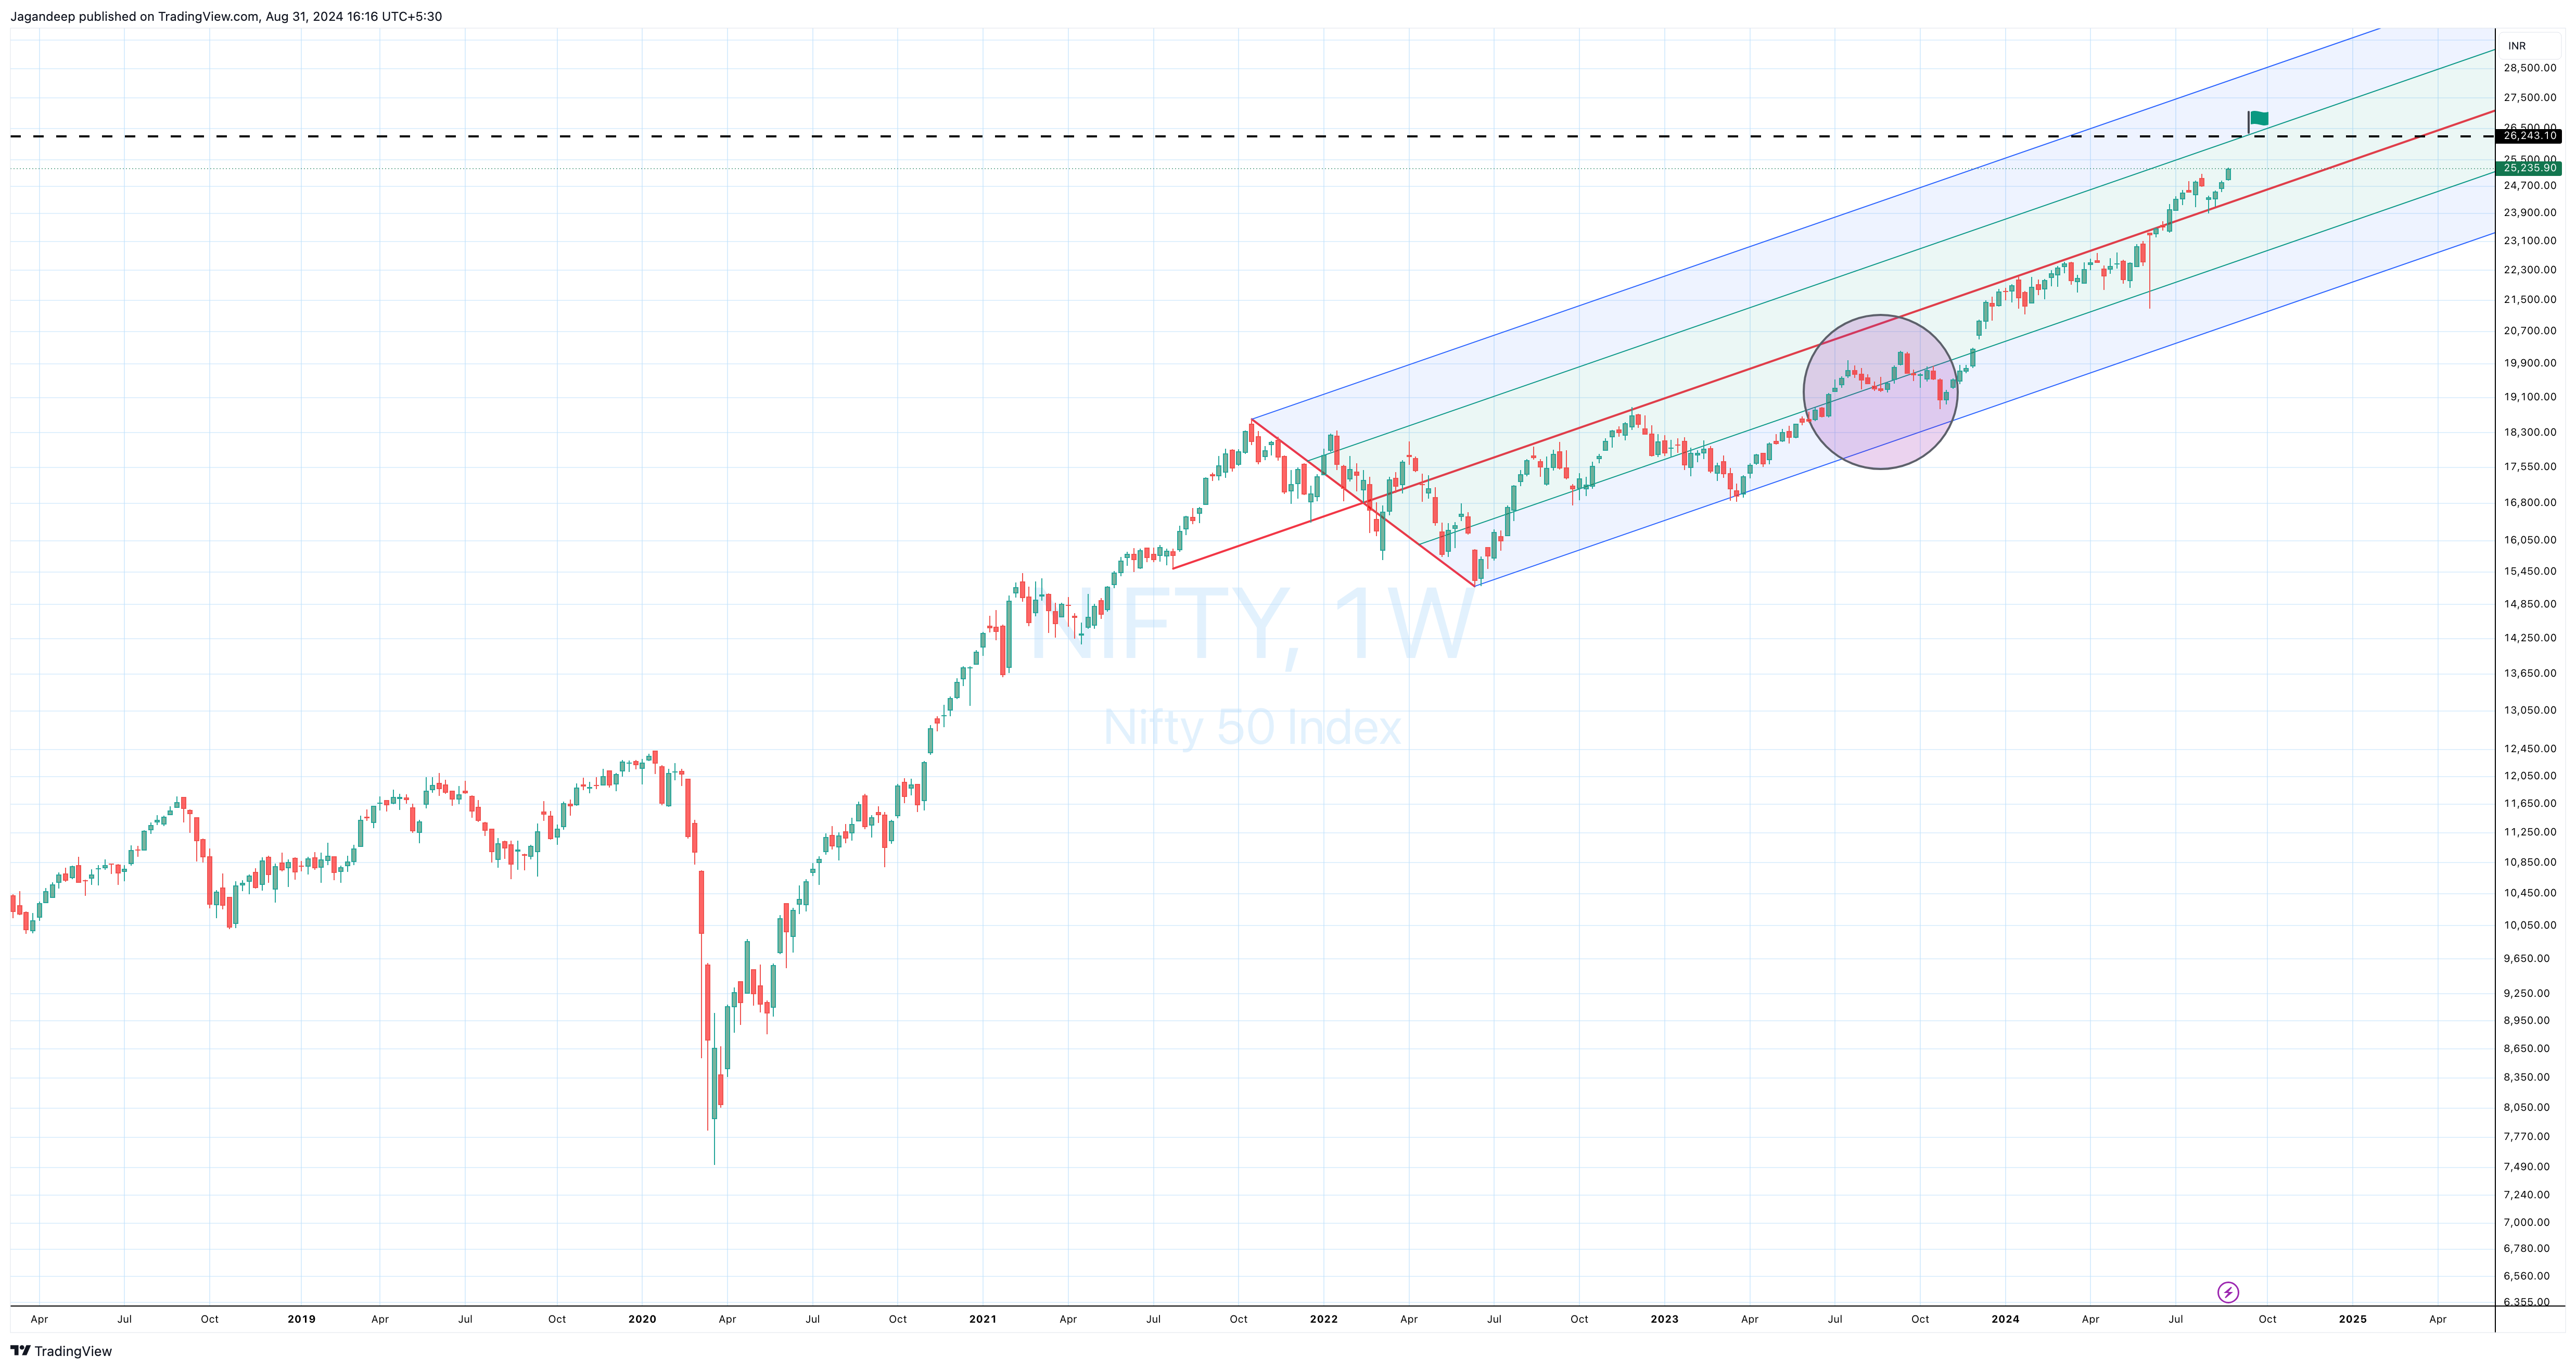
Chart - 1 Pitchfork || Chart 2 - B2B Downside Gap and the NR in 70 || Chart - 3 Pitchfork on the Weekly TF


Analysis Method - Bollinger Bands [What are Bollinger Bands]
Traditionally Bollinger Bands are analysed on the parameters (20 period and 2 Standard Deviations). My variation on this is that depending on the time-frame the parameters vary.
In addition to this, I have created a custom indicator that tracks expansion and contraction in terms of historical standard deviation (a 2nd derivative). I will refer to this as BBE - Bollinger Band Expansion Indicator.
Analysis Method - Custom Momentum Indicators
MADI-Z is Moving Average Dispersion Indicator adjusted with Z-Score. It is direction agnostic and is is published on Trading View. Link HERE
TW-MACD-SD is the Time Weighted MACD Indicator represented in the form of Standard Deviations.
PVMO - Price Volume Momentum Indicators represeted in the form of Stadard Deviations.
VAC-RSI is Time and Volatility adjusted RSI with SMA. This is also published on Trading View.
Analysis Method - Moving Average Analysis
Analysis of multiple moving averages across time frames in terms of relative positioning, crossover, time and distance.
Analysis Method - Tracking multiple Data parameters in terms of time and counts.
The Analysis
Regular readers of my newsletter know that I analyse the market across different time frames. Let’s get started.
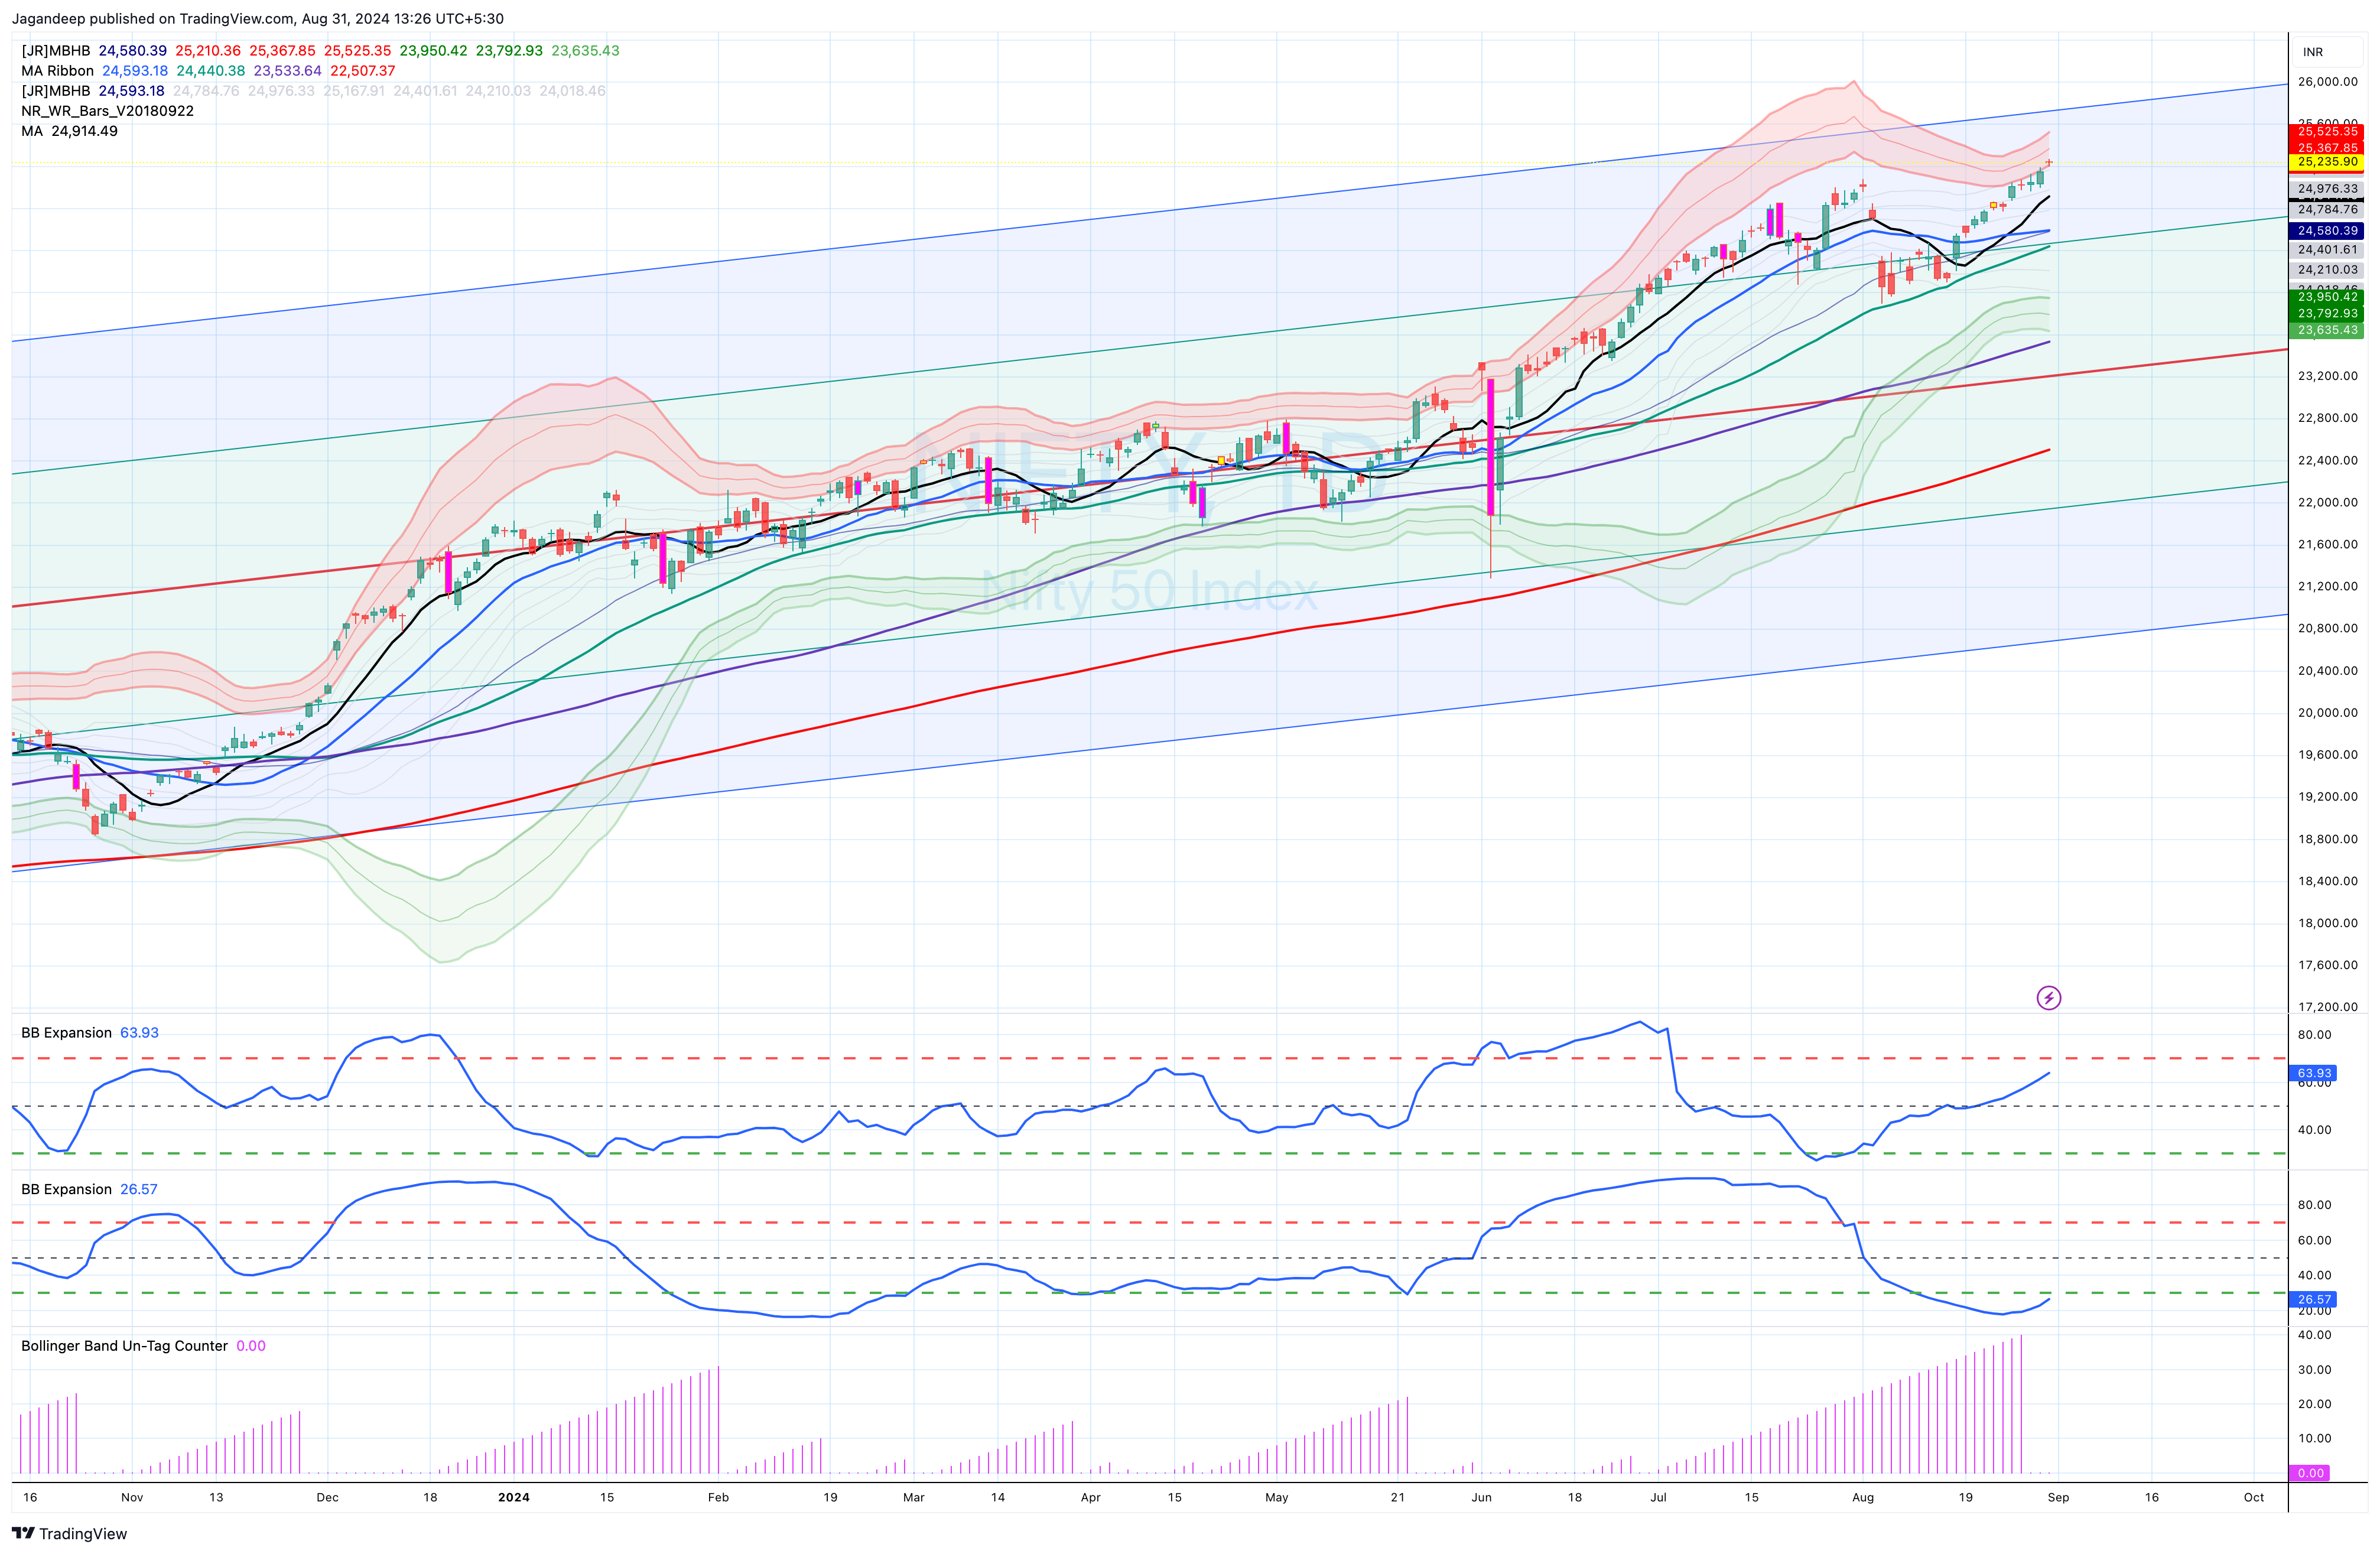
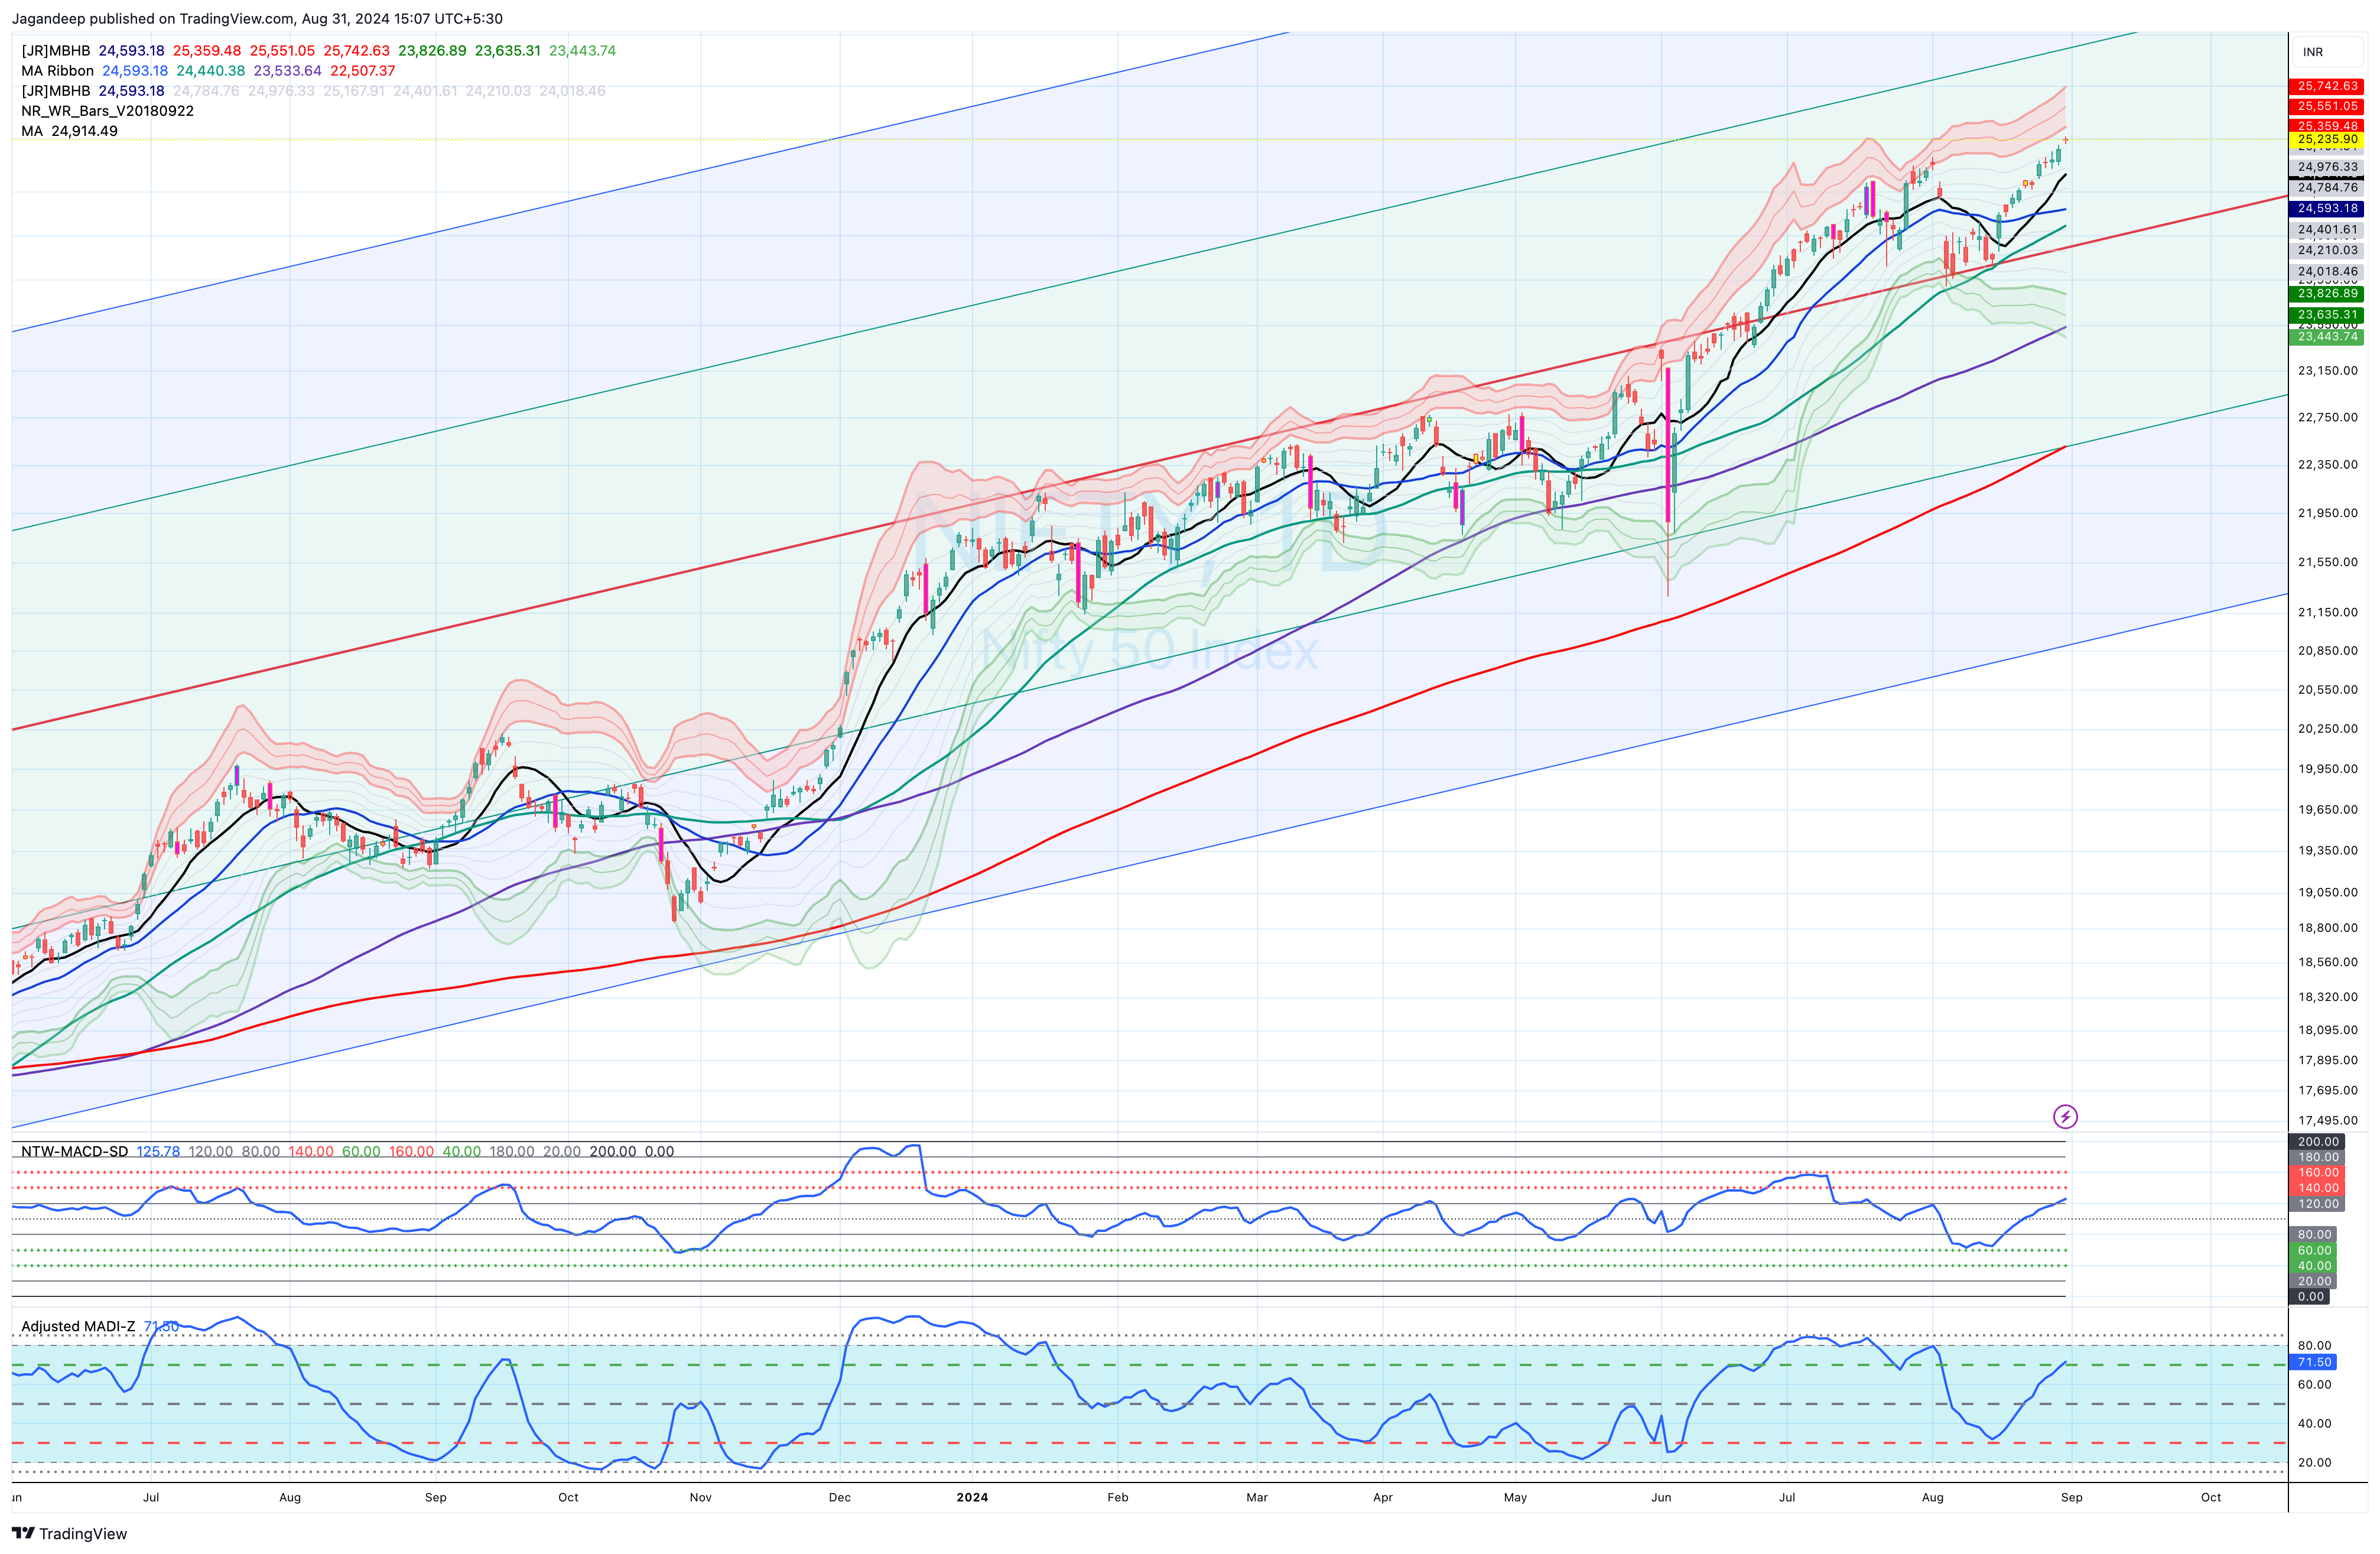
The Daily Time Frame Charts
Bollinger Band Analysis
On the 20 D Bollinger Band,
As expected, the NIFTY completed its short-term correction and started its expansion. (Refer to the first indicator in the chart below)
The BBE has still not reached its minimum upside target, implying there is still space for this expansion.
The more exciting bit is on the 40 D Bollinger Band.
It took the NIFTY 40 days between two consecutive tags of the 2 Standard Deviation. i.e. either the +2 SD or the -2 SD.
Why does it matter? Continuous tagging of the +2 or -2 SD implies strong upside or downside trends. The absence of the tags means consolidation.
This was the 22nd longest streak between two consecutive tags in NIFTY’s history, and this streak ended when the NIFTY tagged the +2 SD on 28th August 2024.
Why is this parameter interesting? I analyzed all such instances where the NIFTY >=35 days between two consecutive tags, and the results are fascinating (Data since 1997)
In 21/30 instances (i.e. 70%), the NIFTY starts a relatively fast move in the direction of the tag (upside in this case). In the remaining 11 instances, the NIFTY reverses within the next 3 - 7 days after the first tag.
In this case, the 2nd tag is the +2SD, and in the 16/20 instances, the NIFTY has made a reasonably fast move to the upside. This move has started immediately or after a minor consolidation over a few days. (between 5 - 10 days)
In 25/30 instances (i.e. 85%), any pullback after such a pattern didn’t take out the swing high or low but instead set up a further move in the direction of the trend. In 15% of instances, the subsequent top or bottom was a major top or bottom.
The Bollinger Band analysis concludes that the NIFTY has space to move to the upside in September 2024, and any subsequent top—in the next 2 or 3 weeks— will not be the major top that takes out the August lows.
The following chart has the BB expansion indicators (20D and 40D) and the Bollinger Band Untag Counter [All of these are my custom indicators].
The Custom Momentum Indicators
The momentum indicators indicate space for a fairly quick move to the upside.
MADI-Z is starting to break out of the 70 level. If the NIFTY breaks out of this level, it will indicate a step up in momentum, whereas a stall here would indicate a pullback is imminent, allowing the Moving Averages to cluster.
The time-weighted MACD represented in SD terms is also starting to take off, which implies that an upside move is pending. This indicator is just taking out +1 SD and should go to at least +2SD or +3 SD (where it topped out before the correction in August).
The interesting Q. that this next move will answer is IF the previous momentum tops will be taken out or if the NIFTY will form a secondary momentum top, indicating momentum divergence.
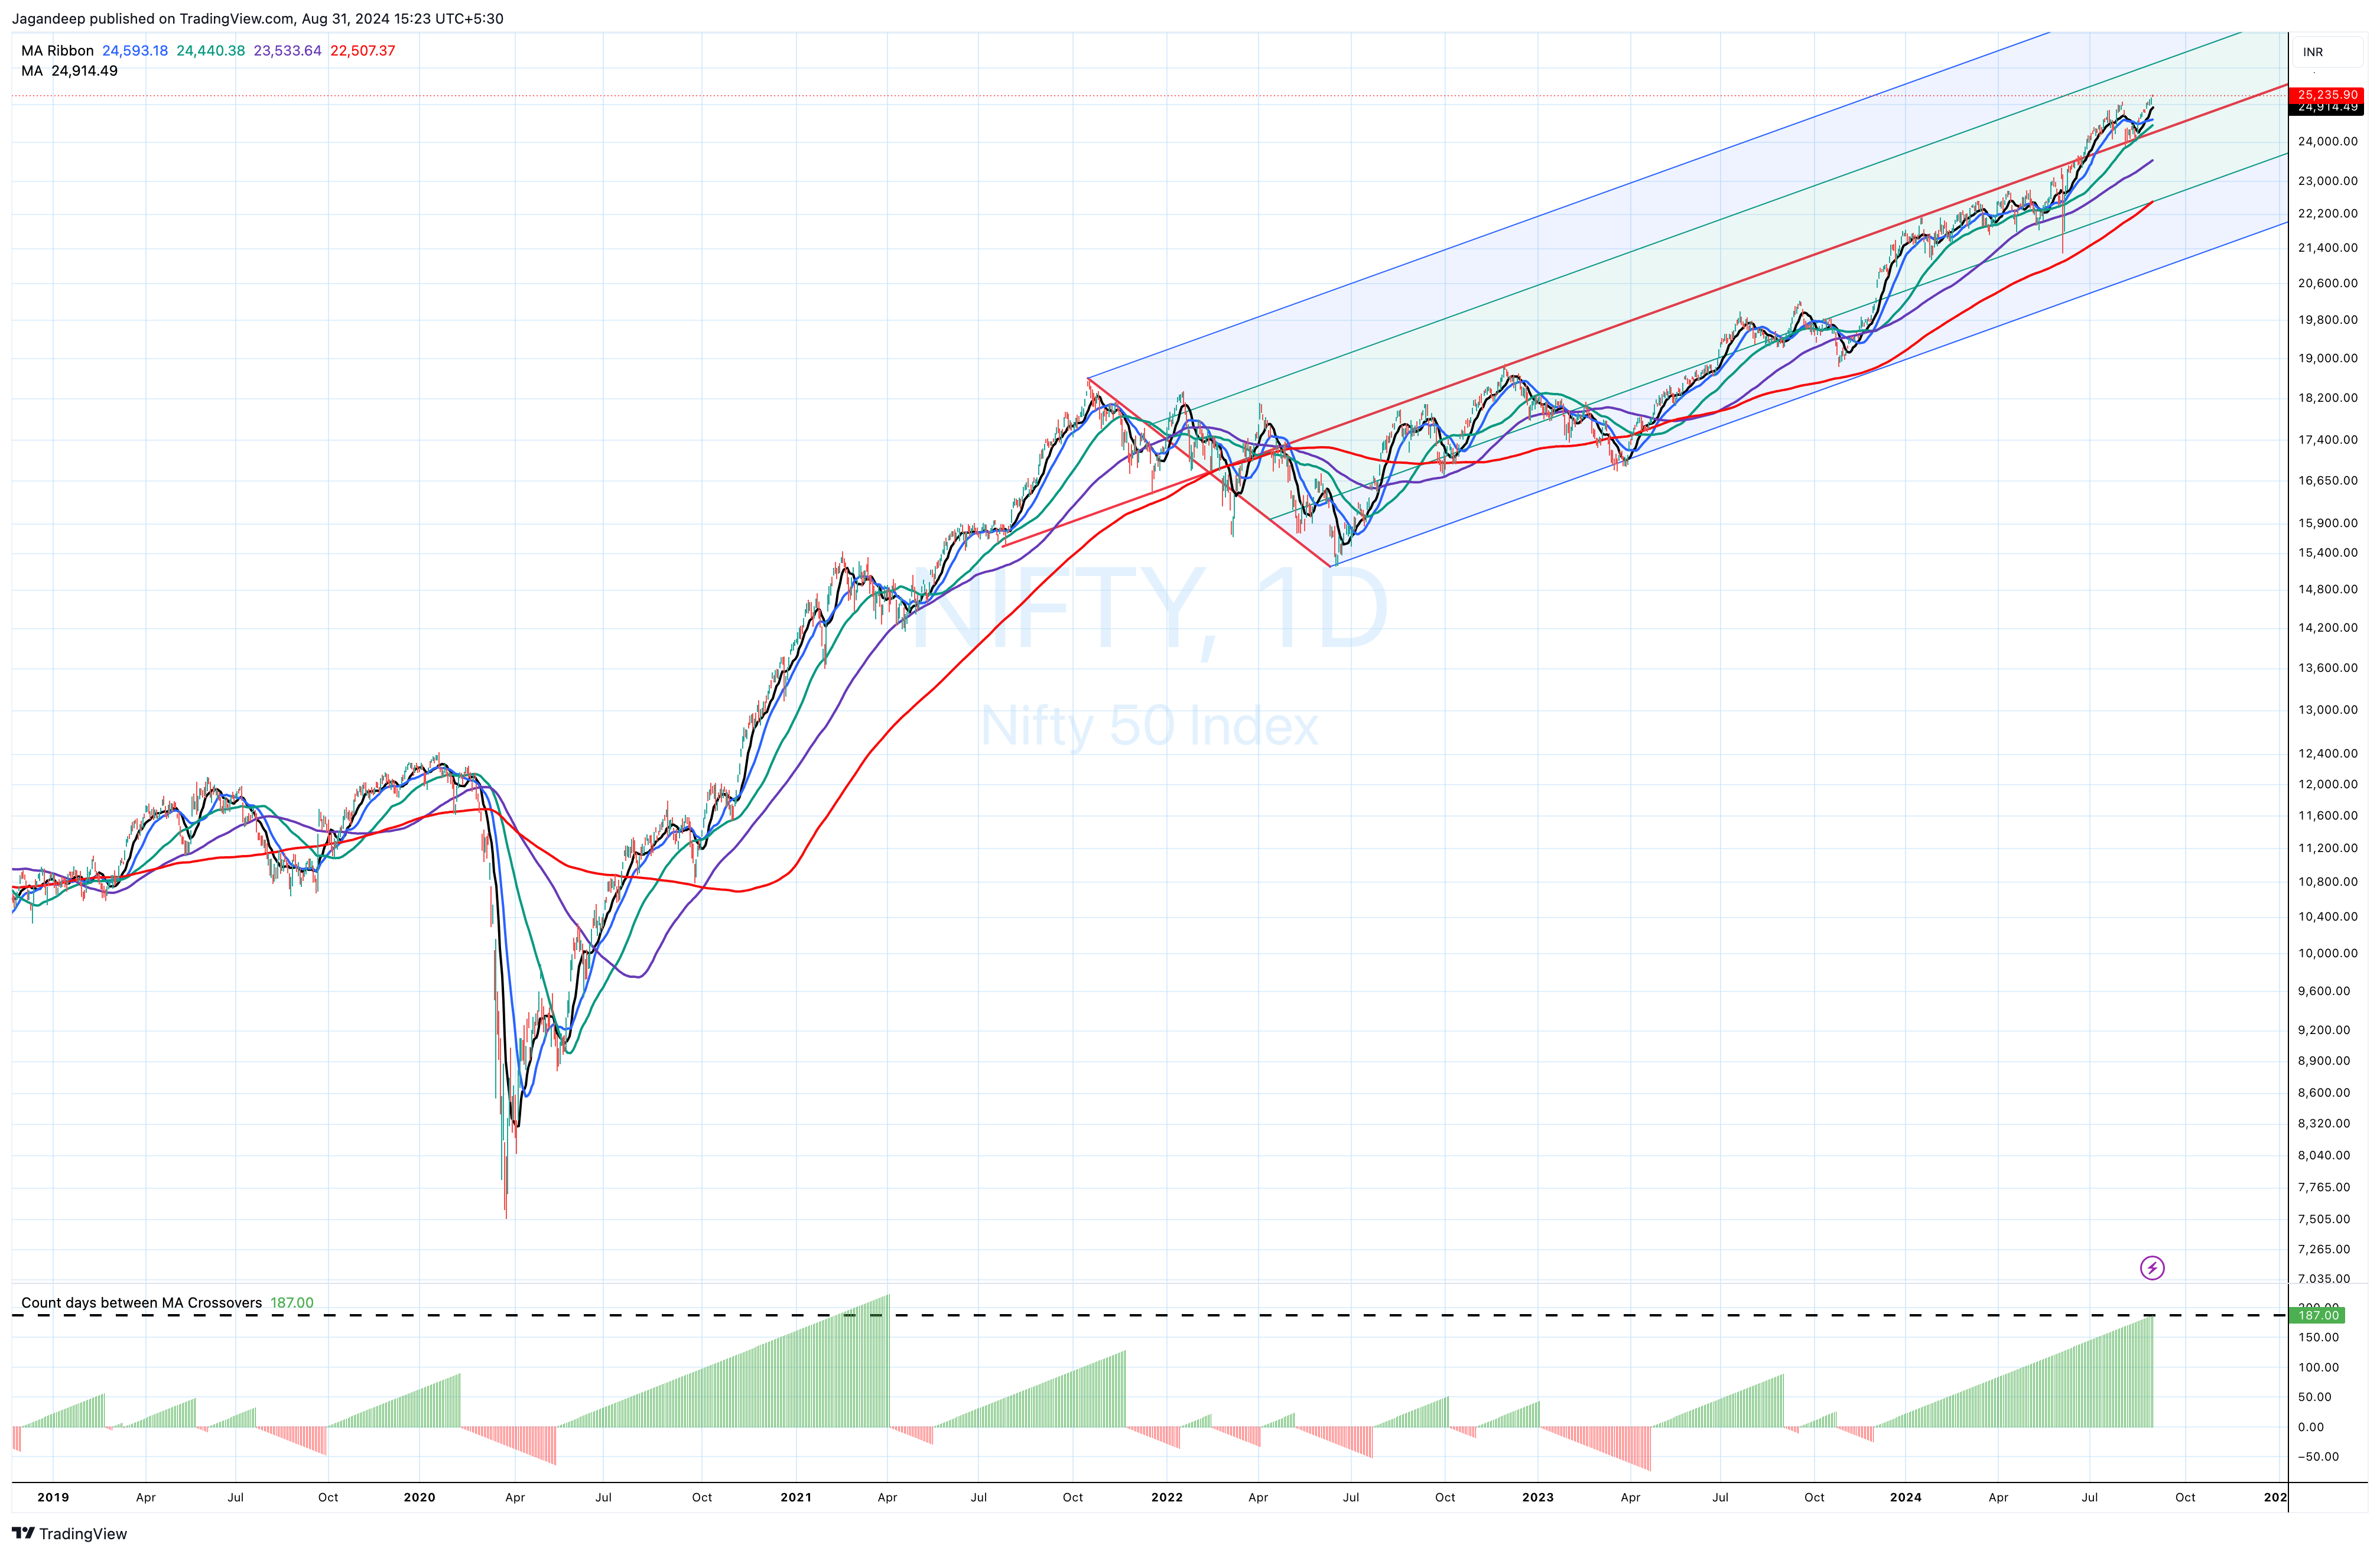
Moving Average Analysis
Some MA Crossover data
The last correction sorted out the short-term MA crossover challenge when the 10D-SMA pulled back to the 20D-SMA, BUT
It has been 187 days since the 20D-SMA is above the 50D-SMA.
This is the 2nd longest streak in history.
The longest streak is 223 days.
On its own, this just means what the values state, but it becomes important when it is aligned with all the other parameters in this post and the ones that are not mentioned here. It allows me to understand the nature of extremes.
The chart below contains the crossover indicator and how it relates to history.
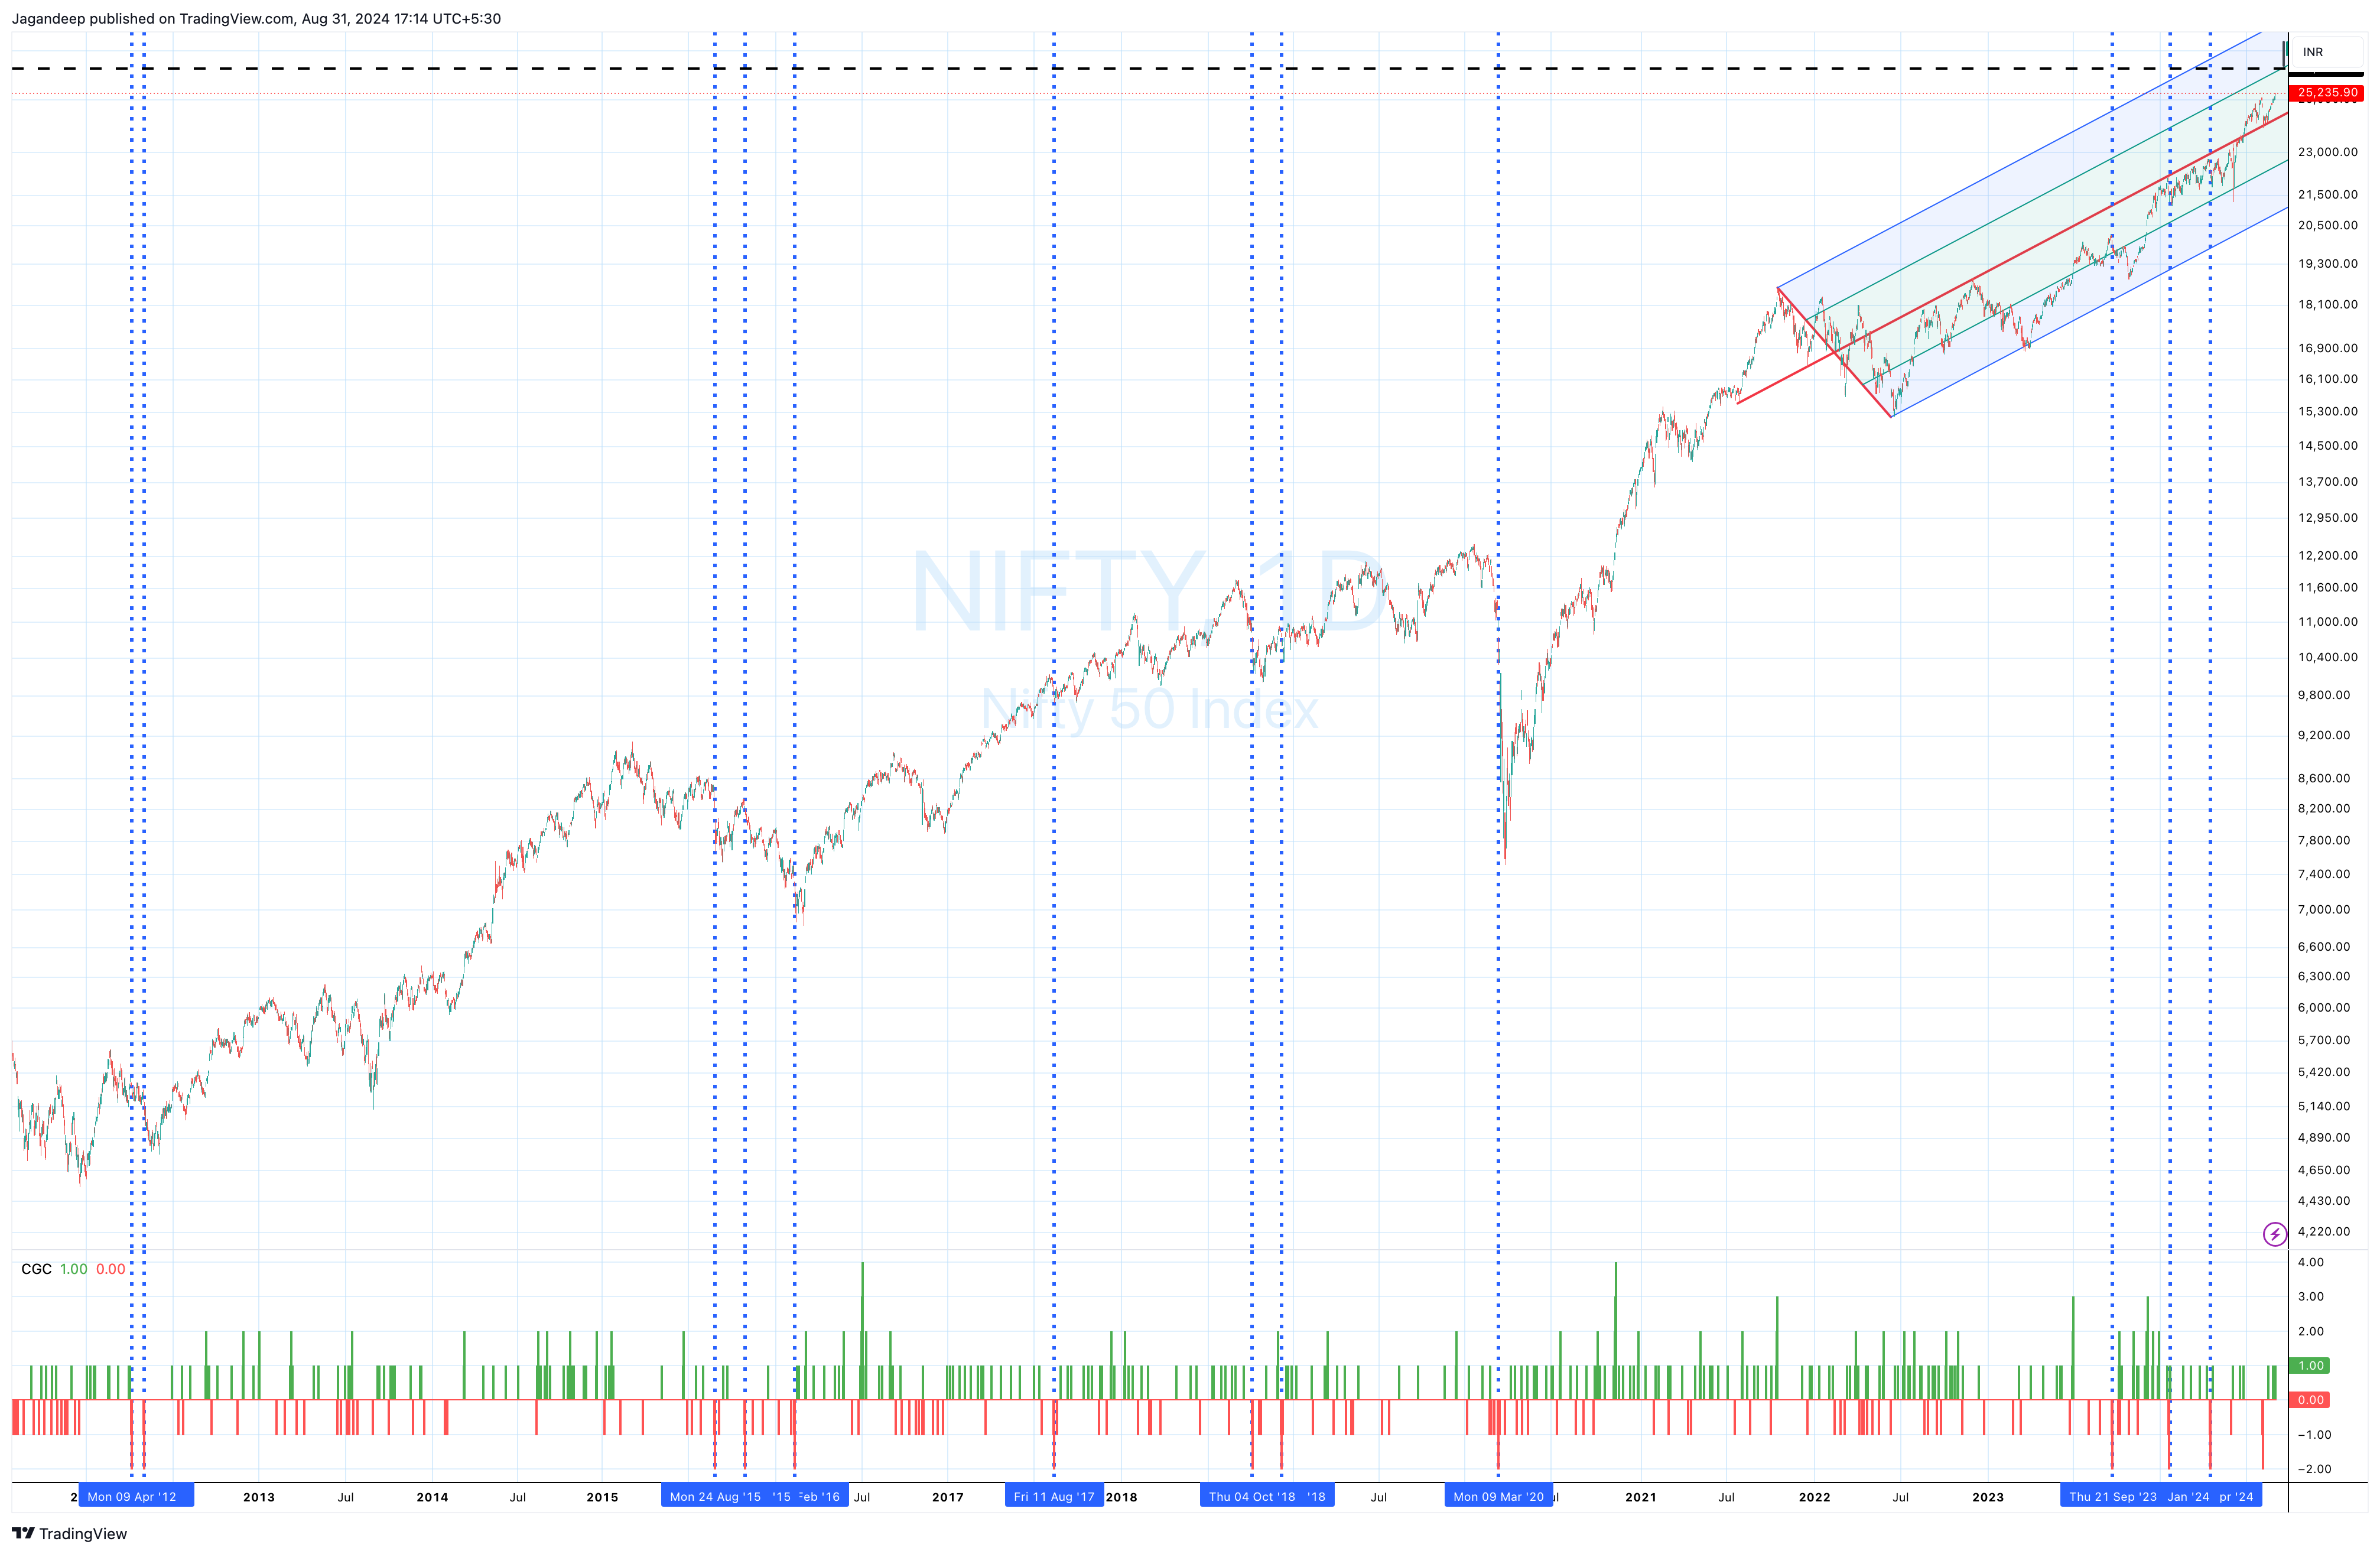
The Gap Analysis
Many people do a superficial analysis of market gaps, and they’re right because gaps rarely serve any real purpose in analysis. The Gaps that I like to look at are Back-to-back gaps. Why? If a stock or an index forms two back-to-back gaps, there is strong buying or selling behind them.
This is the one parameter that completely upended my analysis
Early in August, the NIFTY made two back-to-back downside gaps.
This was the 13th instance of back-to-back downside gaps on the NIFTY since 2010.
7/12 instances occurred in bunches of 2 and 3 near each other.
The last three instances were in September 2023, January 2024, April 2024 and now in August 2024. This is the first time four of these have happened within one year.
This perplexed me because the NIFTY has never effortlessly taken out both the gaps and marched higher (as it seems to be doing this time). This happened only at the end of a long and tiring bear market.
This means that the NIFTY should NOT move higher without a pause but rather pull back into a substantial portion of the last correction before we head much higher.
All the back-to-back downside gaps are documented in the chart below
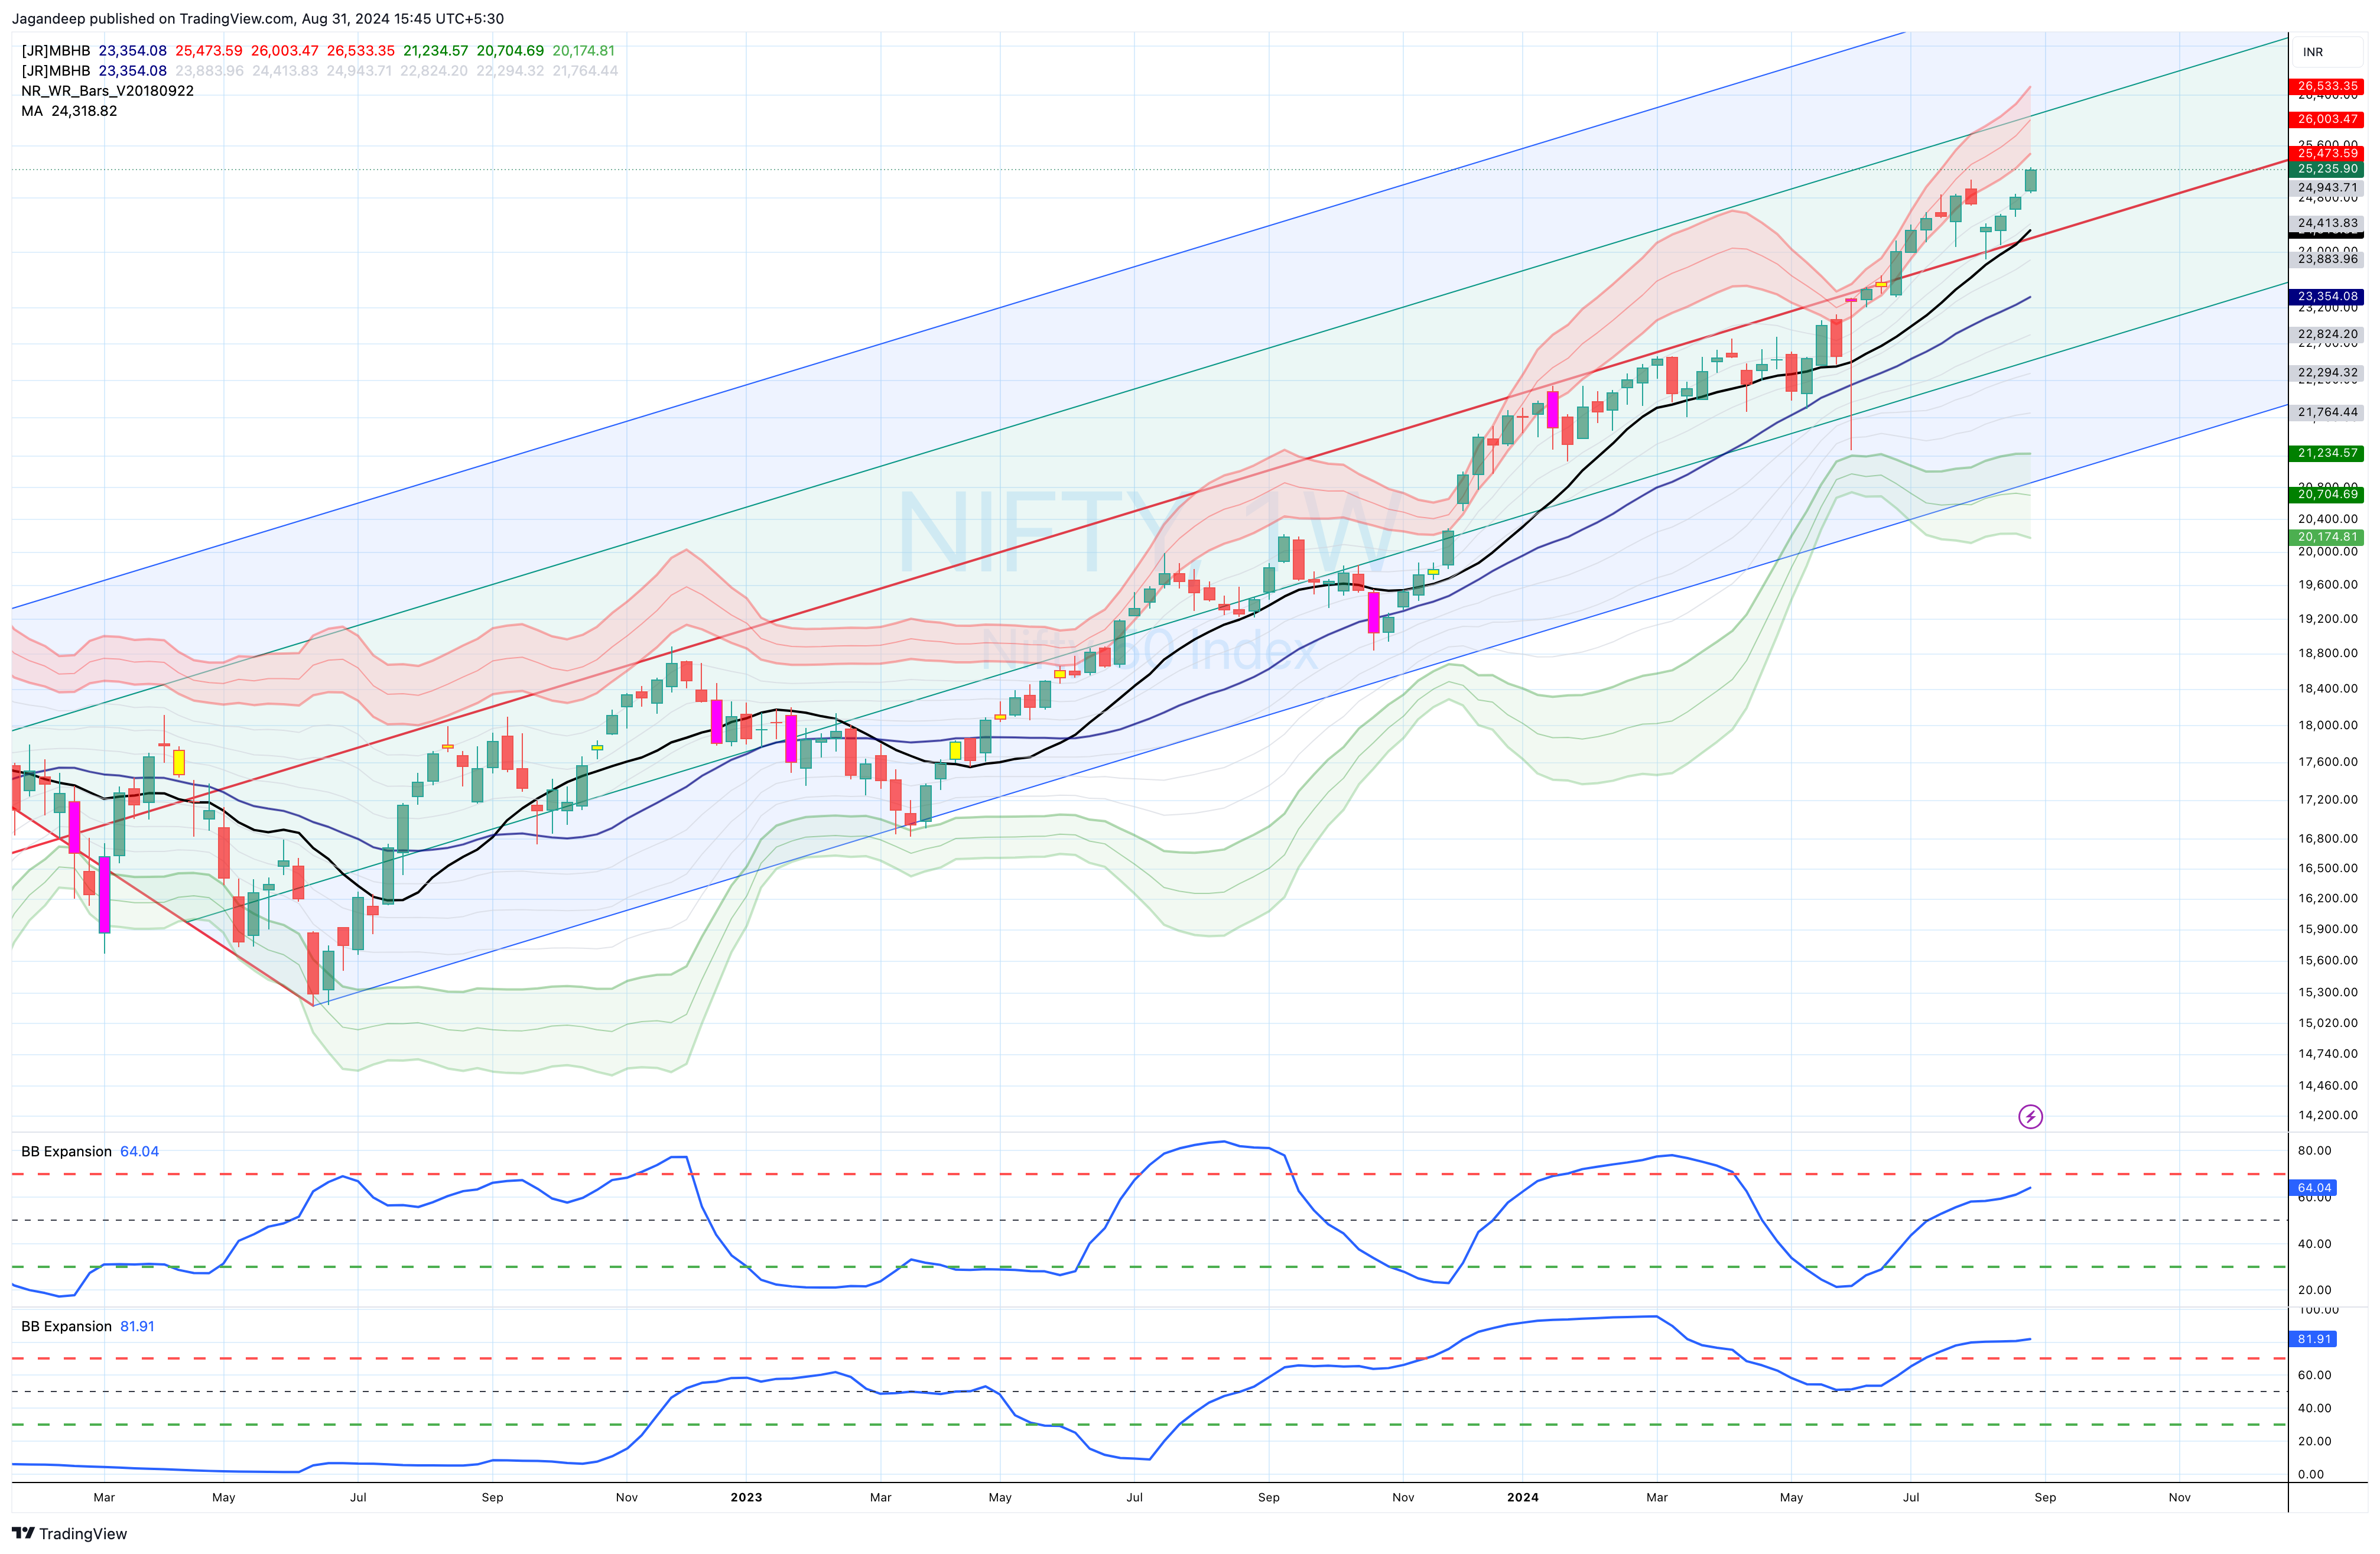
The Weekly Time Frame Charts
Bollinger Band Analysis
On this timeframe, the Bollinger Bands of Interest are 13 weeks (one quarter) and 26 weeks (two quarters or a half-year).
The 26W Bollinger Band is still expanding, and it has more space to grow.
This is even though the NIFTY stopped tagging the +2SD approx. three weeks ago, when the Japanese rate tantrum happened. (Refer to the chart below)
POINT TO WATCH
If the NIFTY - here - fails to tag the +2 SD on this 26W Bollinger Band, then that would be an unambiguous indication that the NIFTY is ready for a fall, but we will know this only over multiple weeks.
Moving Average Analysis
The 13 WSMA (Week Simple Moving Average) has now been above the 26 WSMA for 65 weeks.
As I wrote in my last post, the intermediate tops associated with the longest streaks for this MA crossover have happened when the duration is between 70 - 80 weeks.
The chart below has the 13WSMA and the 26WSMA, 26 Week Bollinger Band, and the 13W - 26W BB Expansion indicators
The Custom Momentum Indicators
The momentum indicators are both dawdling on this time frame at elevated levels. If they start moving lower, that would be the very first indication that the NIFTY’s overdue correction is around the corner.
This could be where the price moves to a new ATH (already has), but the momentum indicators do not corroborate the price move, leading to momentum divergences. [Refer to the highlighted portion of the chart]
Updated from my last post »» Impending and Overdue Correction.
If it was overdue the last time, it has become a tad bit more overdue.
74 weeks since the last 10% correction ended. The only longer streak is 86 weeks.
112 weeks since the last 15% correction ended. The only longer streak is 197 weeks.
219 weeks since the last 20% correction ended. This is an all-time record.
222 weeks since the last 25% correction ended. This is also an All-time record.
The Pitchfork targets are still pending.
The only question is whether the NIFTY does something like the highlighted part or moves up in a straight line to approximately the same level as the flag.
The medium-term outlook
You should read “The Last Hurrah”, esp. the section titled ‘The Countdown to a Top”
The NIFTY is marching to a beat towards an intermediate top, and one fine day, we will discover the bull market of liquidity is done and dusted. Every single one of the parameters mentioned in that post has become a tad worse.
This is just one example of how things can go, whenever this streak of higher highs breaks.
September will - most likely - be the 11th consecutive Higher High on the Monthly charts. The only higher streaks have been
11 months in 2015 - 16
12 months in 2005 - 06
13 months in 2017 - 18
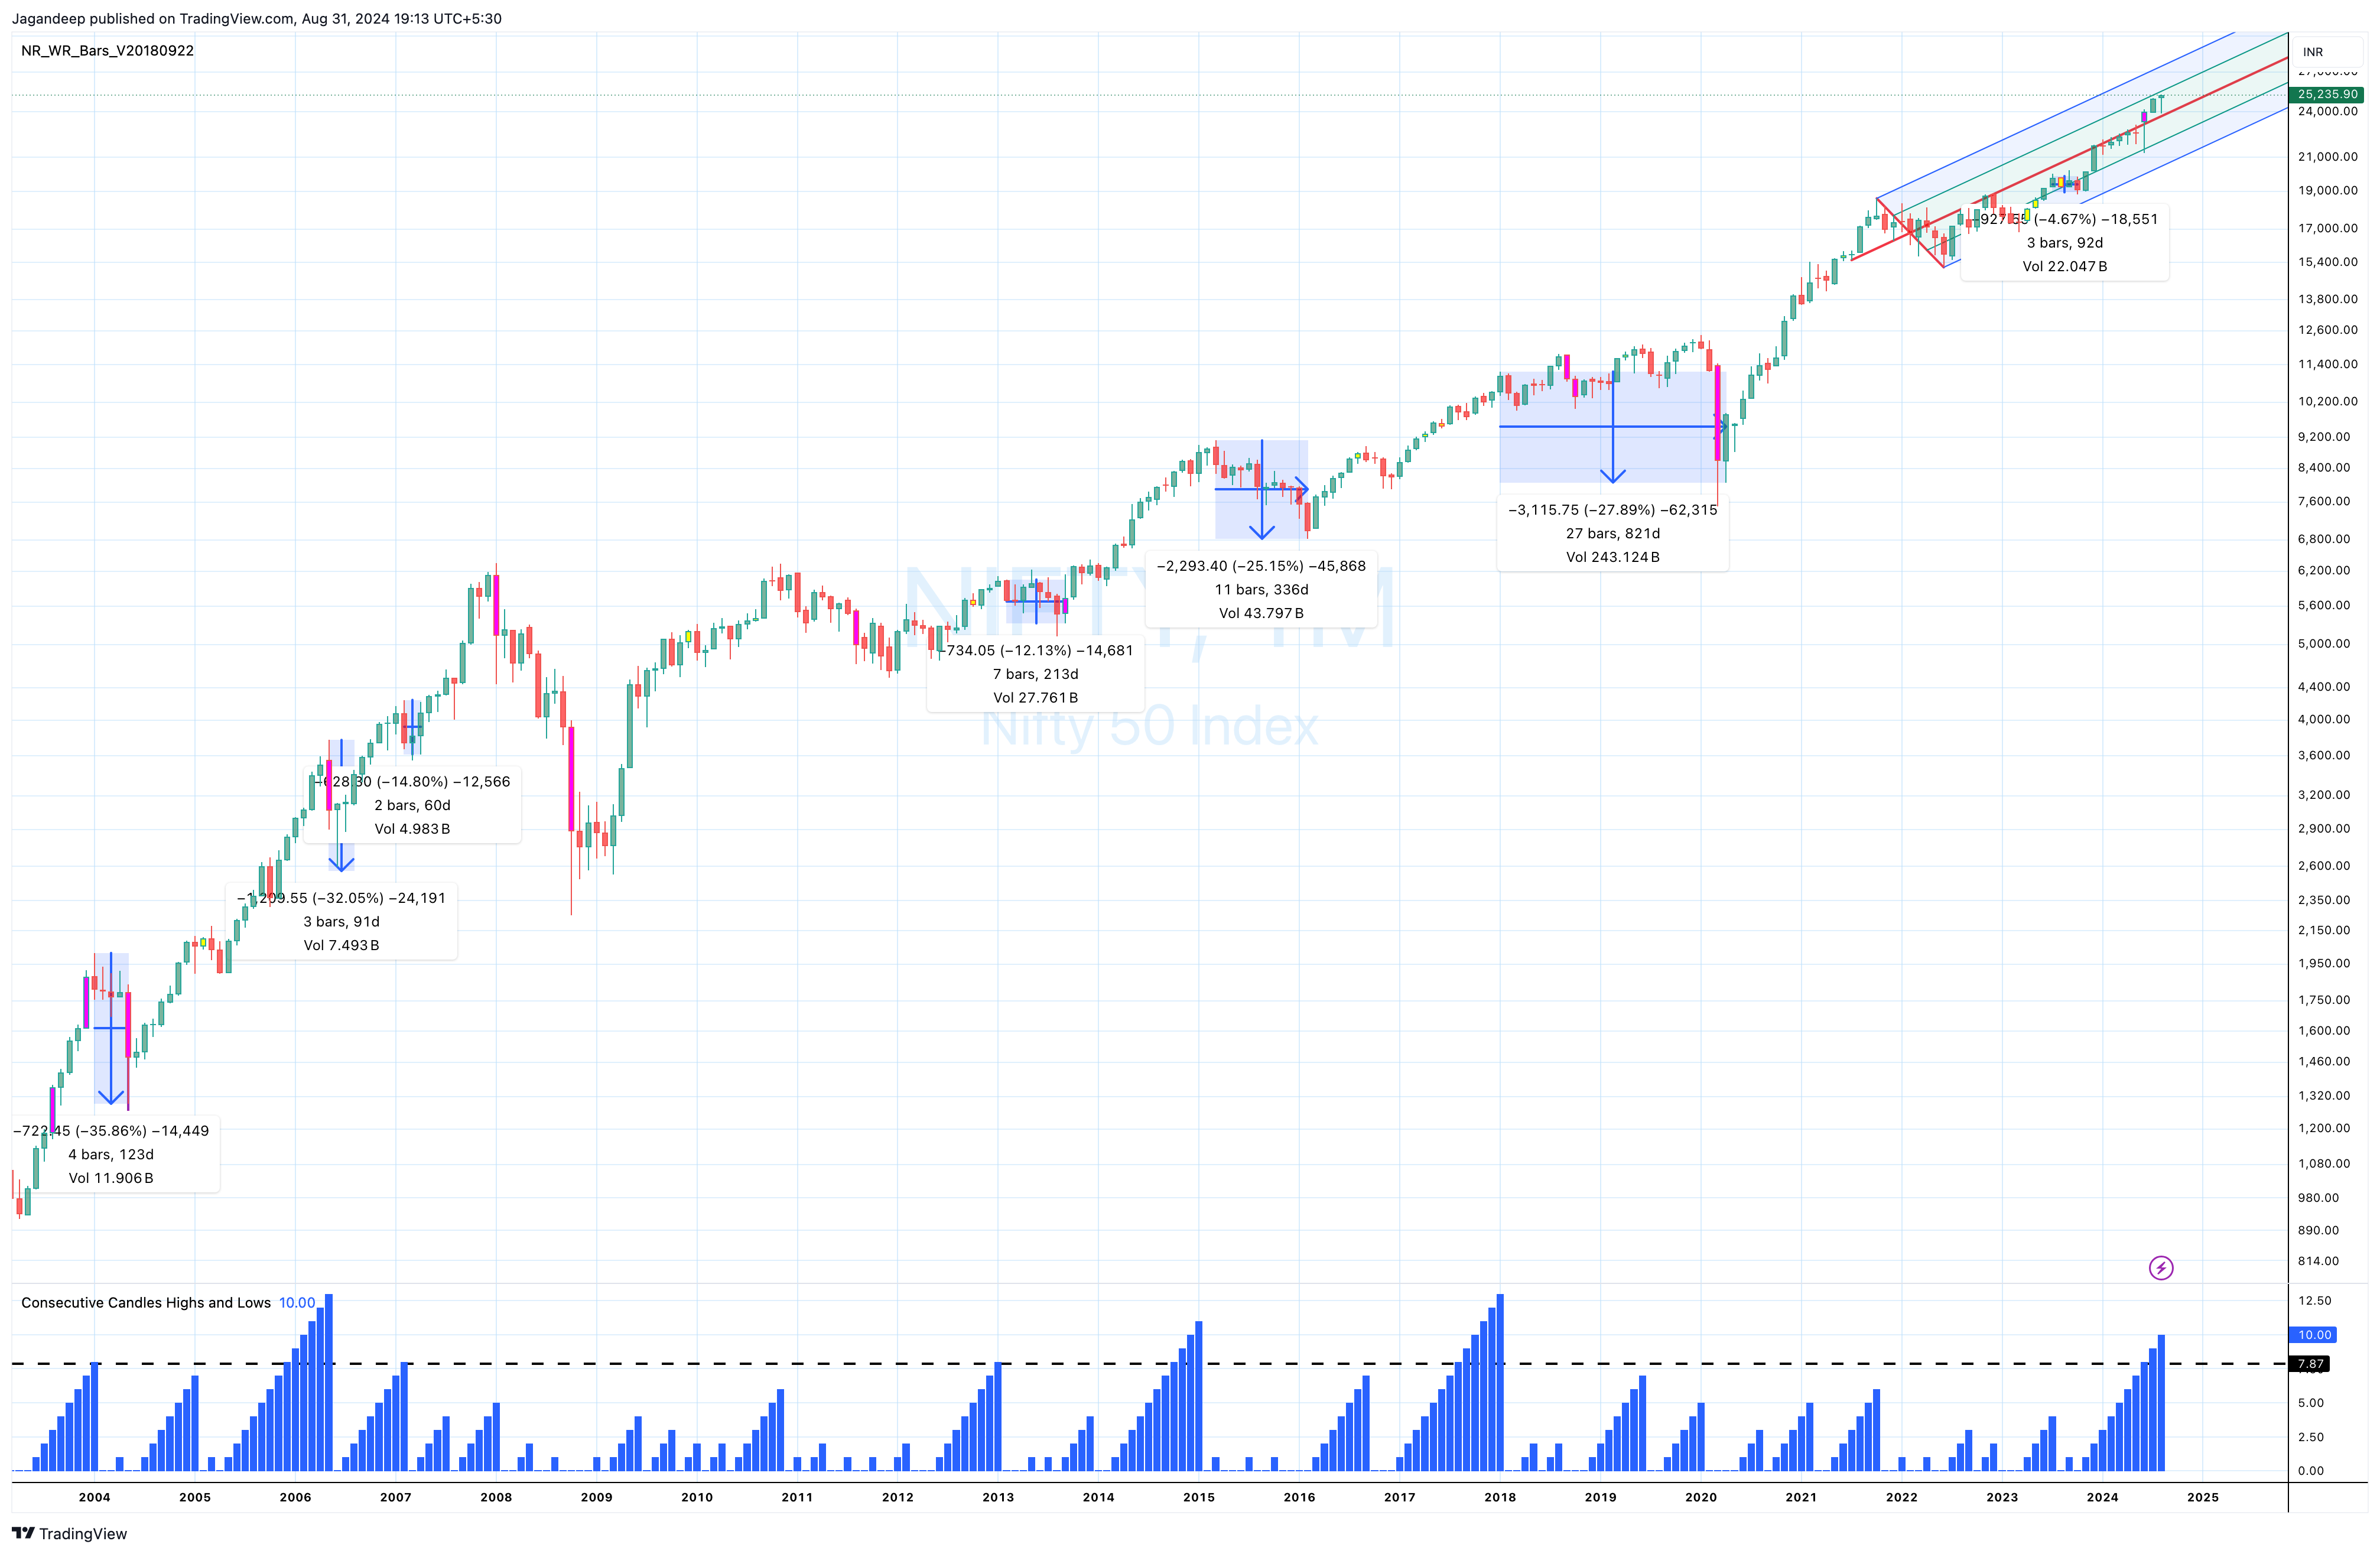
Now, if we step back and look at what happened in prior instances where the NIFTY had a streak of >=8 months with consecutive higher highs, then this is the data
2018 was followed by a 30-month consolidation that ended with a 30%+ correction in March 2020.
A 30%+ correction followed the 2006 streak in two months.
The 2015-16 correction was followed by a 26% fall over 12+ months.
The three instances with streaks of 8 consecutive higher highs all had follow-up corrections of between 12.2% and 14.8%
Chart for reference. We’ll be lucky to escape with a 12%ish correction.
Status Check - The Anatomy of the Next Correction
This is a portion from my last post, “Is this the top” titled “The anatomy of the next correction”
Assuming the above doesn't happen, the NIFTY’s price action associated with a large correction will proceed on some variation of the following steps
Stop tagging the +2 SD on the 26W Bollinger Band.
Take support in the first correction at or near the 10WSMA, or, in the worst case, near the 20WSMA.
Bounce back and lose momentum. Either make a very tepid new high or don't even make a new high.
Depending upon (2), either slow down at 20WSMA or take it out to the downside.
Fall and pull back, but not exceed the previous swing high (e.g., look at what happened in 2015 - 2016 or 2021 - 23).
Break the previous low and continue to make lower highs and lower lows.
The moving average or the indicator periods may differ, but this will be the broad outline of how any major correction will play out.
Status Check
Points no. 1 and 2 are done.
Point no. 3 is in progress, and unless it substantially crosses 26K with momentum, this will be another step in the countdown to the major correction. We should see momentum divergences in this move up.
Conclusions of the Analysis
Most Likely
The most likely target of 25500, within the range of 2550 - 27000, is pretty much done. The NIFTY’s current high is less than 1% from 25500.
In the very short term, we could see some more move to the upside while different indicators reach their extremes.
This move could be either a grind upwards or a very quick fast move of 3% - 5%. Neither would surprise me nor would nullify the setup for a major follow-up correction.
I won’t be surprised to see 26K on the NIFTY in September, and even 26500 is possible.
In a blow-out scenario, the top could also go beyond 27K over the next 2 - 3 months, and we’ll know when this move ends.
Less Likely
A September top and a break below 23900.
The only way I see this happening is with a black swan.
The analysis is meant to be foremost a journal of my analysis. Consider it as such and use it for your analysis. I’m not a SEBI-certified market analyst. I also post market analysis on Twitter with the handle @SeldonOnMarkets