


Is this the top?
A status check on whether this is the major top

My last post was titled “The Last Hurrah” and discussed the impending major correction, but it is time to see whether the minor pullback signifies just a pullback or is something more than that.
The Baseline
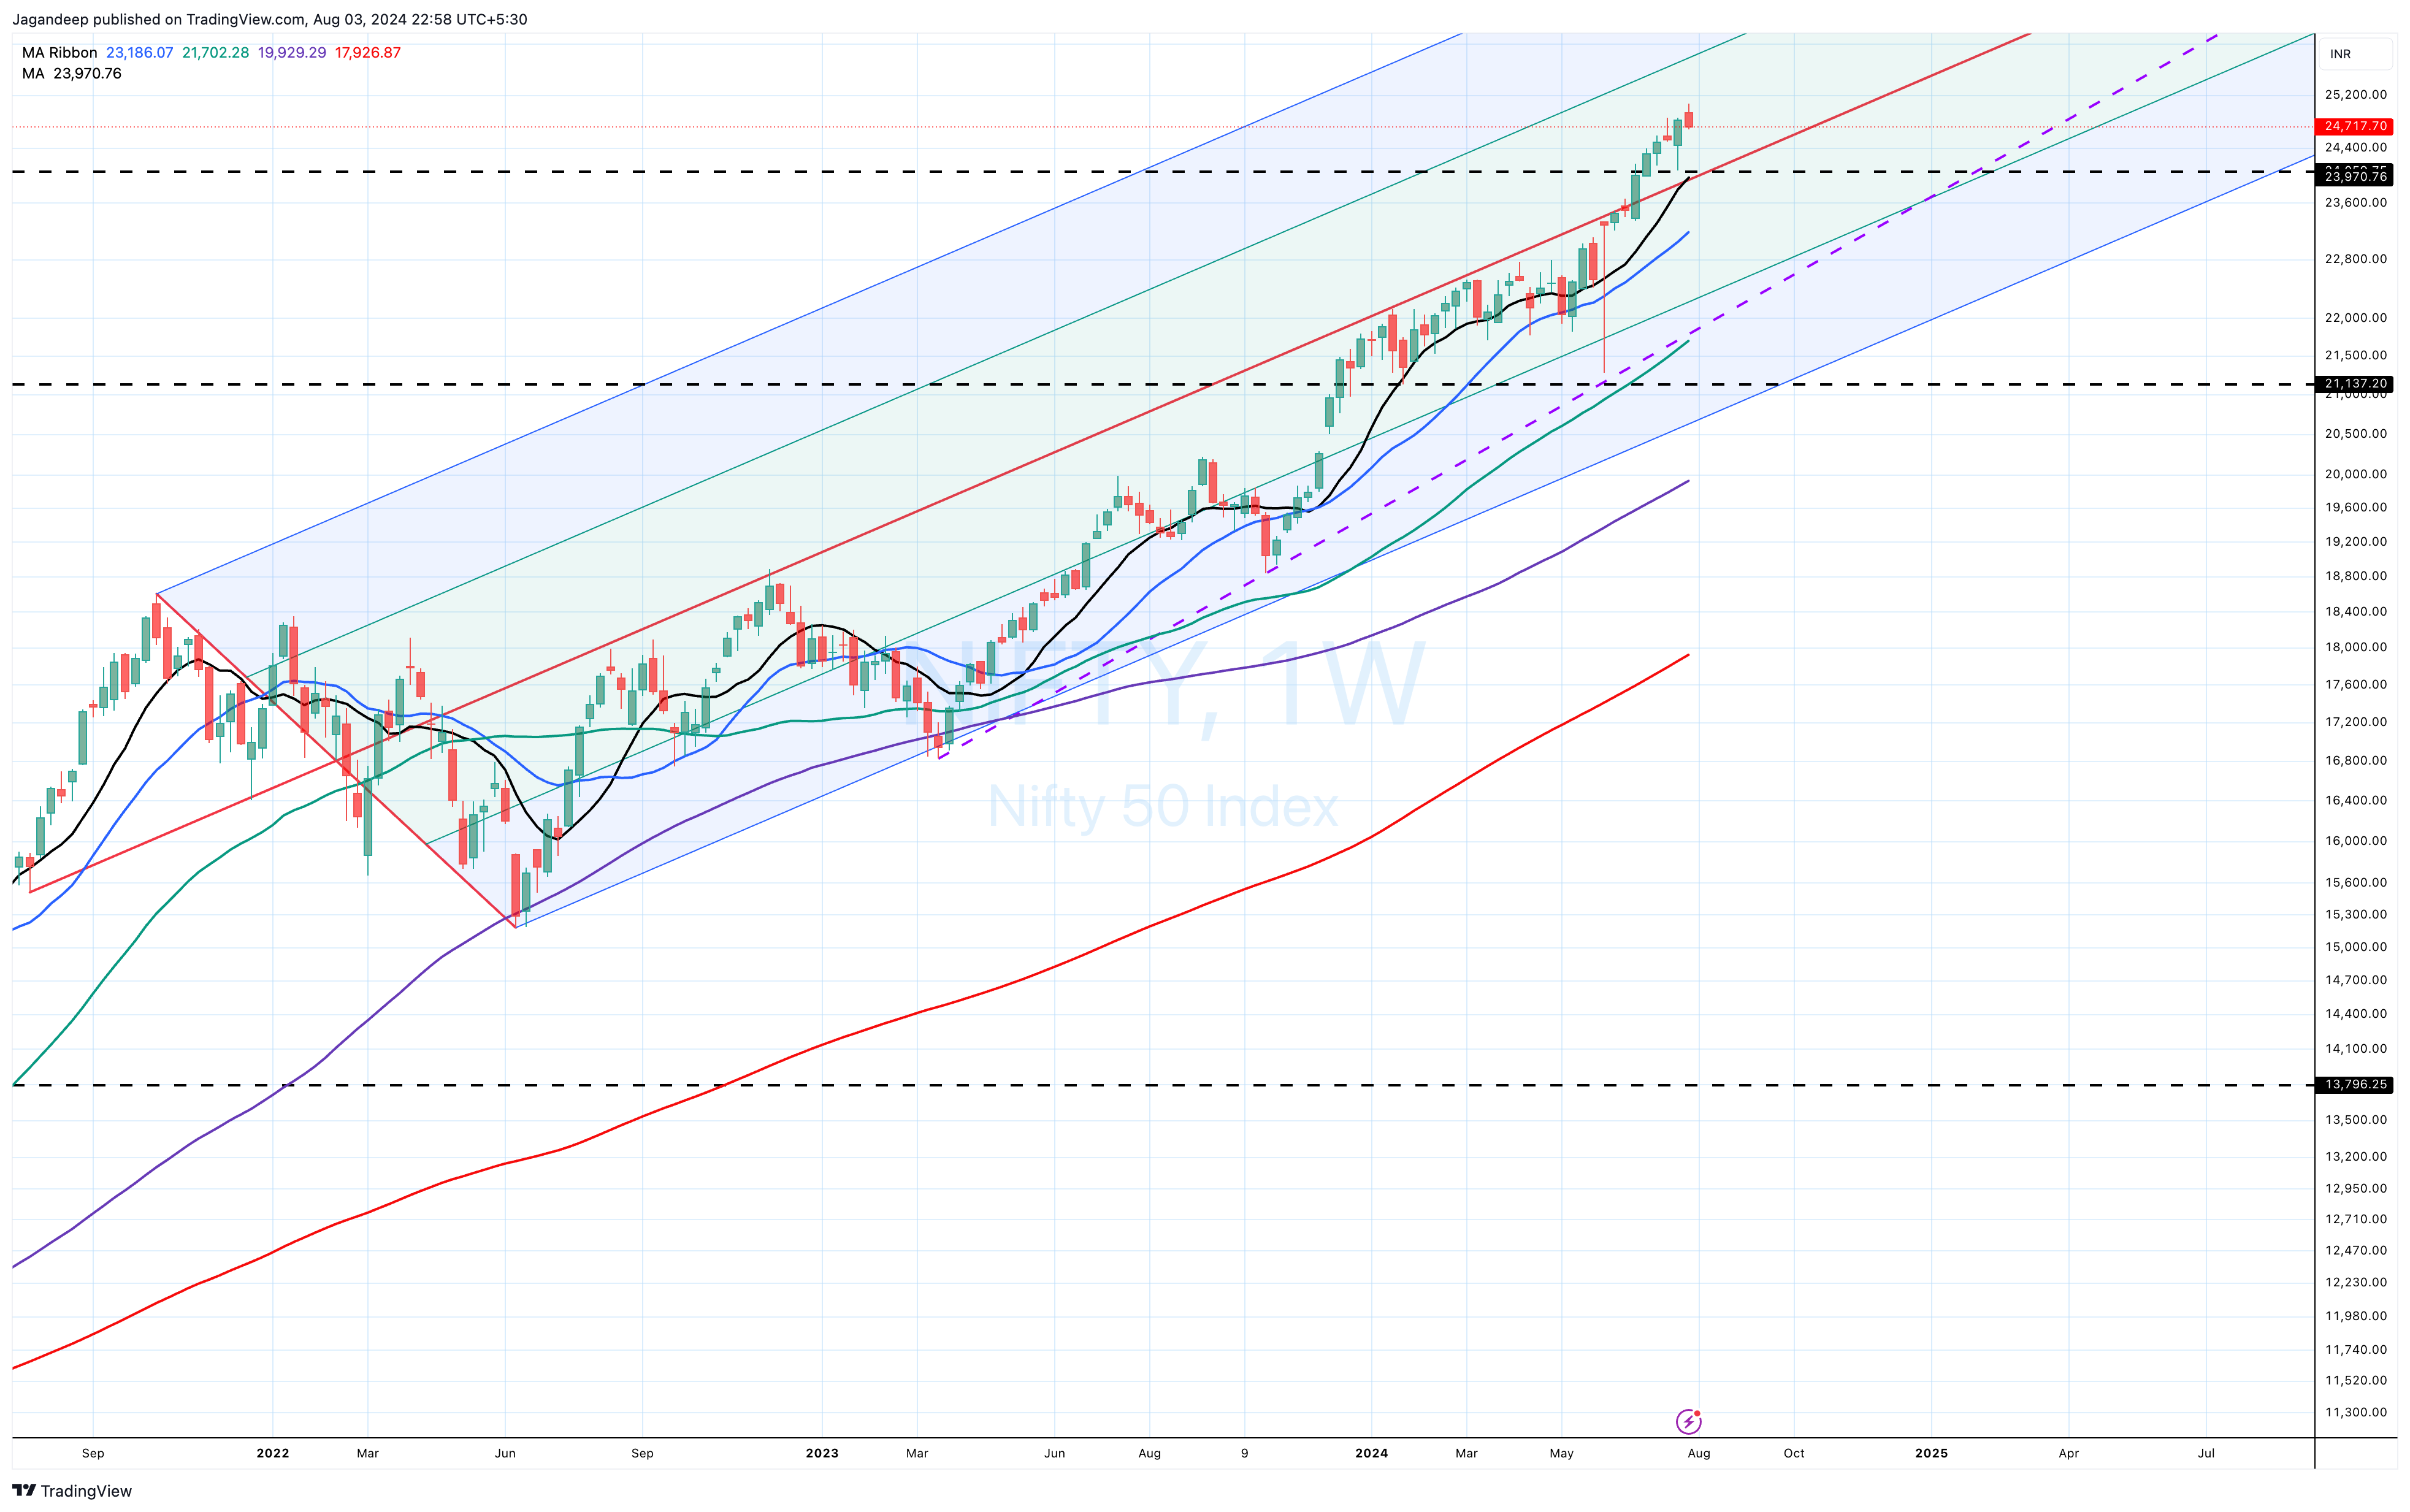
During the week, NIFTY finally crossed the 25 K level but saw some selling.
The current top is 25078.20, and by the end of the week, it had pulled back to close at 24717.70.
In this minor pullback, the NIFTY ended at the 10 DSMA at 24701.59. The 20 DSMA is currently just a tad lower at 24578.
The interesting bit from Friday was the gap down. The NIFTY made a downside gap between 24956 and 24851. This becomes a critical level to note.
The Analysis
Daily Time-Frame
Bollinger Band Analysis
One of the things I do is utilize the Bollinger Bands across multiple periods (after all, they’re essentially just price and Standard Deviations). On the Daily time frame, I use 20 days (one trading month) and 40 days (two trading months)
One of the variant indicators of Bollinger Bands denotes expansion vs contraction. On the shorter time-frame, this has now pulled back to -1 Standard Deviation, implying ongoing price consolidation is reaching an extreme on this time-frame.
It may not seem like it, but even in the longer time frame, the NIFTY has not tagged either of its momentum Standard Devations (+/-2) for 24 days.
It is now the 4th longest streak for the NIFTY between consecutive tags of the -2 Standard Deviation (40 days), The longer streaks are 218 days, 227 days and 453 days.
Momentum has stalled across multiple indicators. This has happened at momentum resistances (2 SD for MADIZ, the MACD SD variation and even the Price Volume Momentum Indicator).
Moving Average Analysis
One way to determine price and time extremes is to evaluate how moving averages behave relative to each other.
The 10 DSMA has been above the 20 DSMA for 49 days, and this tends to stretch at a maximum of 60 - 70 days.
For this to happen, there has to be a decent-ish price correction over a 3 - 4 week period so that the 10-day moving average comes sharply lower, but the 20-day moving average at the very least stays where it is. The correction could be higher too.
As an example, the last time it happened was a correction from 22125 to 21137 i.e. 4.5%
The NIFTY has also now spent 41 days above the 20 DSMA. With that moving average at 24578, it is fairly likely that this one can get broken early next week.
Weekly Time frame
The NIFTY has had a few good weeks in this time frame
The 26-week Bollinger Bands are still expanding, partly because the NIFTY has now tagged the +2SD for nine consecutive weeks. This is a textbook trend.
As the price moves in one direction, the standard deviations increase, and if the price continues to tag the standard deviation, it amplifies the trend.
The same is happening on the 52-week Bollinger Bands as well, except that they seem to have reached an extreme. The NIFTY has tagged the +2SD here for six consecutive weeks.
The NIFTY has had 11 consecutive weeks of higher highs and 8 consecutive weeks of higher closes. Why the longer streaks?
Higher Highs 12 weeks and 17 weeks.
Higher Closes - Nine weeks, 10 weeks and 11 weeks.
The momentum indicators for the weekly time frame are doing okay. Points to watch
Points to keep a watch on
71 consecutive weeks where standard RSI has been >= 40 weeks. This streak has ended between 9x - 10x across history except for one instance that ended in the mid 130s.
The above is a lagging indicator.
Extrapolating the same indicator to tops provides us the duration when these tops happened i.e. 71 weeks - 79 weeks - 86 weeks ad 89 weeks. (exceptr for one instance).
It has bee 61 weeks since the 13 WSMA >= 26 WSMA. Historically, the longer streaks have ended at 80 weeks (twice - where the top happened after 70 weeks in both instances) and 96 weeks weeks (once - where the top happened after 80 weeks)
There are no major updates on the longer time frames.
The (Impending?) and overdue Correction
The following is data on how long it has been since the last X% correction.
70 weeks since the end of the last correction >= 10%
2nd longest streak in NIFTY’s history
The all-time record duration is 86 weeks.
It has been 106 weeks since the last 12.5% correction. This is an all-time record; the second-longest streak was two incidents of 91 weeks.
It has been 108 weeks since the last 15% correction. This is the second-longest streak in history; the all-time record is 197 weeks.
215 weeks since the last 20% correction. This is an all-time record. The 2nd longest streak is 209 weeks.
It has been 218 weeks since the end of the last 25% correction, which is also an all-time record. The second-longest streak is 215 weeks.
Now the question that comes up is how would a correction of even 10% to 25% pan out? I tweeted about it here as well. Link to Tweet
I’ll elaborate the same here as well.
Types of Corrections
There are multiple types of corrections in the markets (mostly).
The quick and fast downside moves are mostly driven by news (2020 as an example)
The other one is the slow, steady and painful corrections or bear markets (2021 - 2023 being an example).
The 3rd one is sort of a combination of the two where either a weakened market already on the threshold of a bear-market gets hit by news (i.e. a slow moving bear-market is turbocharged by news) or a fast news-driven correction turns into a longer bear-market.
The second or the third bear market is the tricky one & always runs the risk of turning into a major bear driven by news. This is the "Winter is coming" bear-market.
The anatomy of the next correction?
A news-driven hit can happen anytime. It did on 4th June, and we all saw the dramatic reversal. The chances that we get a quick news-driven 20%+ downside move would need catastrophic news, e.g., a full-scale war in the Middle East. This is a true black swan and can't be predicted.
If it isn’t news driven then larger corrections are driven by what I call “Transmission of poor price action”. What does that mean?
Poor price action kicks off on the Daily Time Frame. i.e. price breaks and sustains below key Moving Averages i.e. 20 DSMA and 50 DSMA.
Poor price action on the Daily Time Frame can only extend up to a certain level.
A correction just on this time frame likely won’t extend beyond 5% - 7%.
It can stop here, and the correction could be done.
On the other hand, poor price action can spread to the next time frame, the weekly time frame.
In this case, the price will break the key Moving Averages on this time frame (e.g., 20WSMA or larger MA)
A correction just on this time frame likely won’t extend beyond 10% - 15%.
It can stop here, and the correction could be done.
Assuming the above doesn't happen, the NIFTY’s price action associated with a large correction will proceed on some variation of the following steps
Stop tagging the +2 SD on the 26W Bollinger Band.
Take support in the first correction at or near the 10WSMA, or, in the worst case, near the 20WSMA.
Bounce back and lose momentum. Either make a very tepid new high or don't even make a new high.
Depending upon (2), either slow down at 20WSMA or take it out to the downside.
Fall and pull back, but not exceed the previous swing high (e.g., look at what happened in 2015 - 2016 or 2021 - 23).
Break the previous low and continue to make lower highs and lower lows.
The moving average or the indicator periods may differ, but this will be the broad outline of how any major correction will play out.
Where are we now?
Considering the import of the breakout, it seems like there is unfinished business for the NIFTY.
The NIFTY has not even tested any of these moving averages: the 20 DSMA, the 50 DSMA, the 10 WSMA, or the 20 WSMA.
The NIFTY is above the lows of the previous two week candle and the lows from the last month.
The NIFTY is still making a higher high in the monthly time frame.
Momentum has slowed.
Conclusions of the Analysis
Most Likely
The most likely scenario is the NIFTY doesn’t break the combination of the 50DSMA + the middle line of the pitchfork.
It may not even reach that point, but a 4% - 6% correction can never be ruled out. Even if it gets there, I don’t expect the NIFTY to break or sustain below 23900 - 24100.
At this point, I’d expect any follow-up rally to finish at the expected targets of 25500 - 27000.
This potential pullback would determine the contours of the next correction.
If this doesn’t make a substantial new high, that is trouble. A top around 25500 won’t be enough.
Less Likely
The NIFTY breaks below the level of 23900 - 24100 with momentum, and we will see at least a 10% correction this fall.
The only way I see this happening is with a black swan.
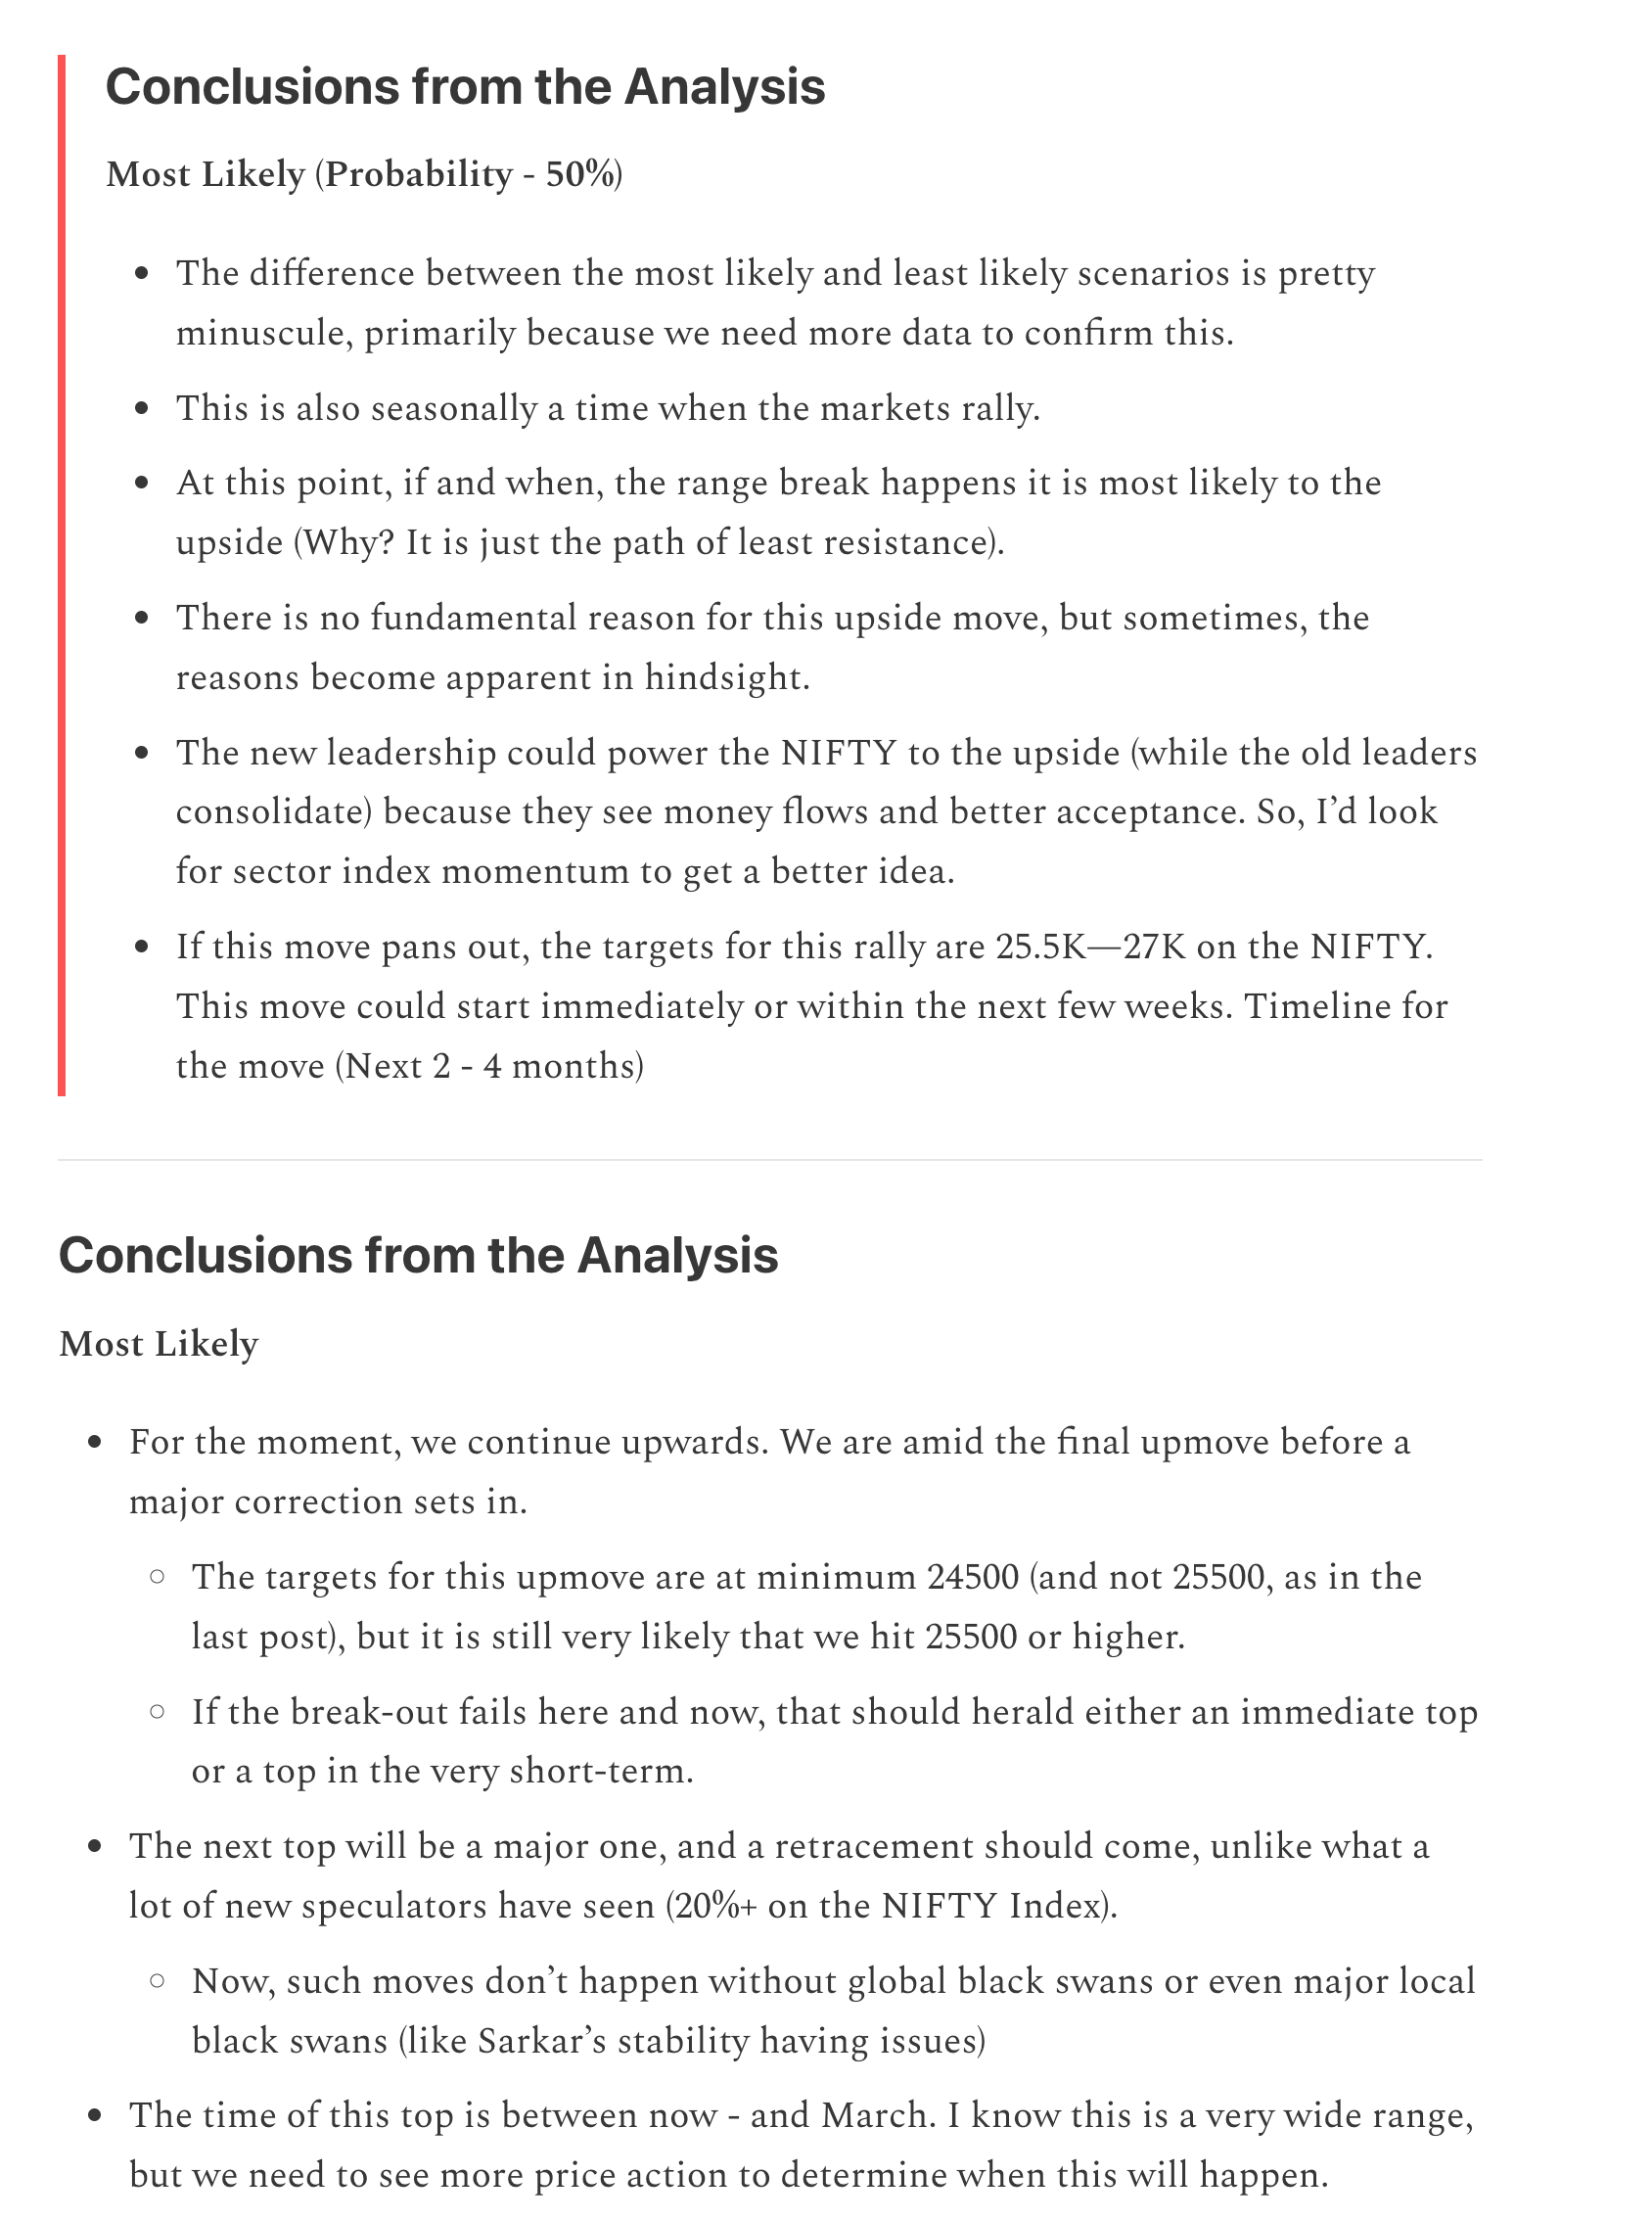
Summary and conclusions from my last two posts
The following image conveys the conclusions from my last two posts. As you can see, it's fairly on target.
The analysis is meant to be foremost a journal of my analysis. Consider it as such and use it for your analysis. I’m not a SEBI-certified market analyst. I also post market analysis on Twitter with the handle @SeldonOnMarkets