


The Last Hurrah
The winter is coming?

“This is the end
Hold your breath and count to ten
Feel the Earth move and then” ….
For this is the end
I've drowned and dreamt this moment" ...
"Let the Sky falls
When it crumbles
We will stand tall" ….- “Sky Fall” by Adele
From the OST of Sky Fall (2012)
Most of the time, I write the post as I analyze the markets, so the flow of the post can feel disjointed at times. This time, though, my analysis is done, and the above song (one of my favourites) is the theme of the post. I mean, when everything is going right, the few hundred-odd subscribers of this substack are interested to know when it can all go wrong.
Before I go any further, Congratulations to Team India for winning the T20 World Cup. This was a real win, and they had to fight their way to the finish line to lift the trophy. I don’t think I recall a game where the bowling team won defending 30 of 30.
This was also the T20 swansong of two of the greatest players in this format (Virat and Rohit), and I hope they get the same chance in other formats to sign off as World Champions. Now that the monkey is off the back, may we see a flurry of championships that this team deserves.
Finally, a special thanks to Rahul Dravid for his service to Indian cricket. He wasn’t my favourite coach, but he deserves a whole lot more for just being Dravid, fronting up for the team and showing these players the way in an era where cricket is less and less about the sport.
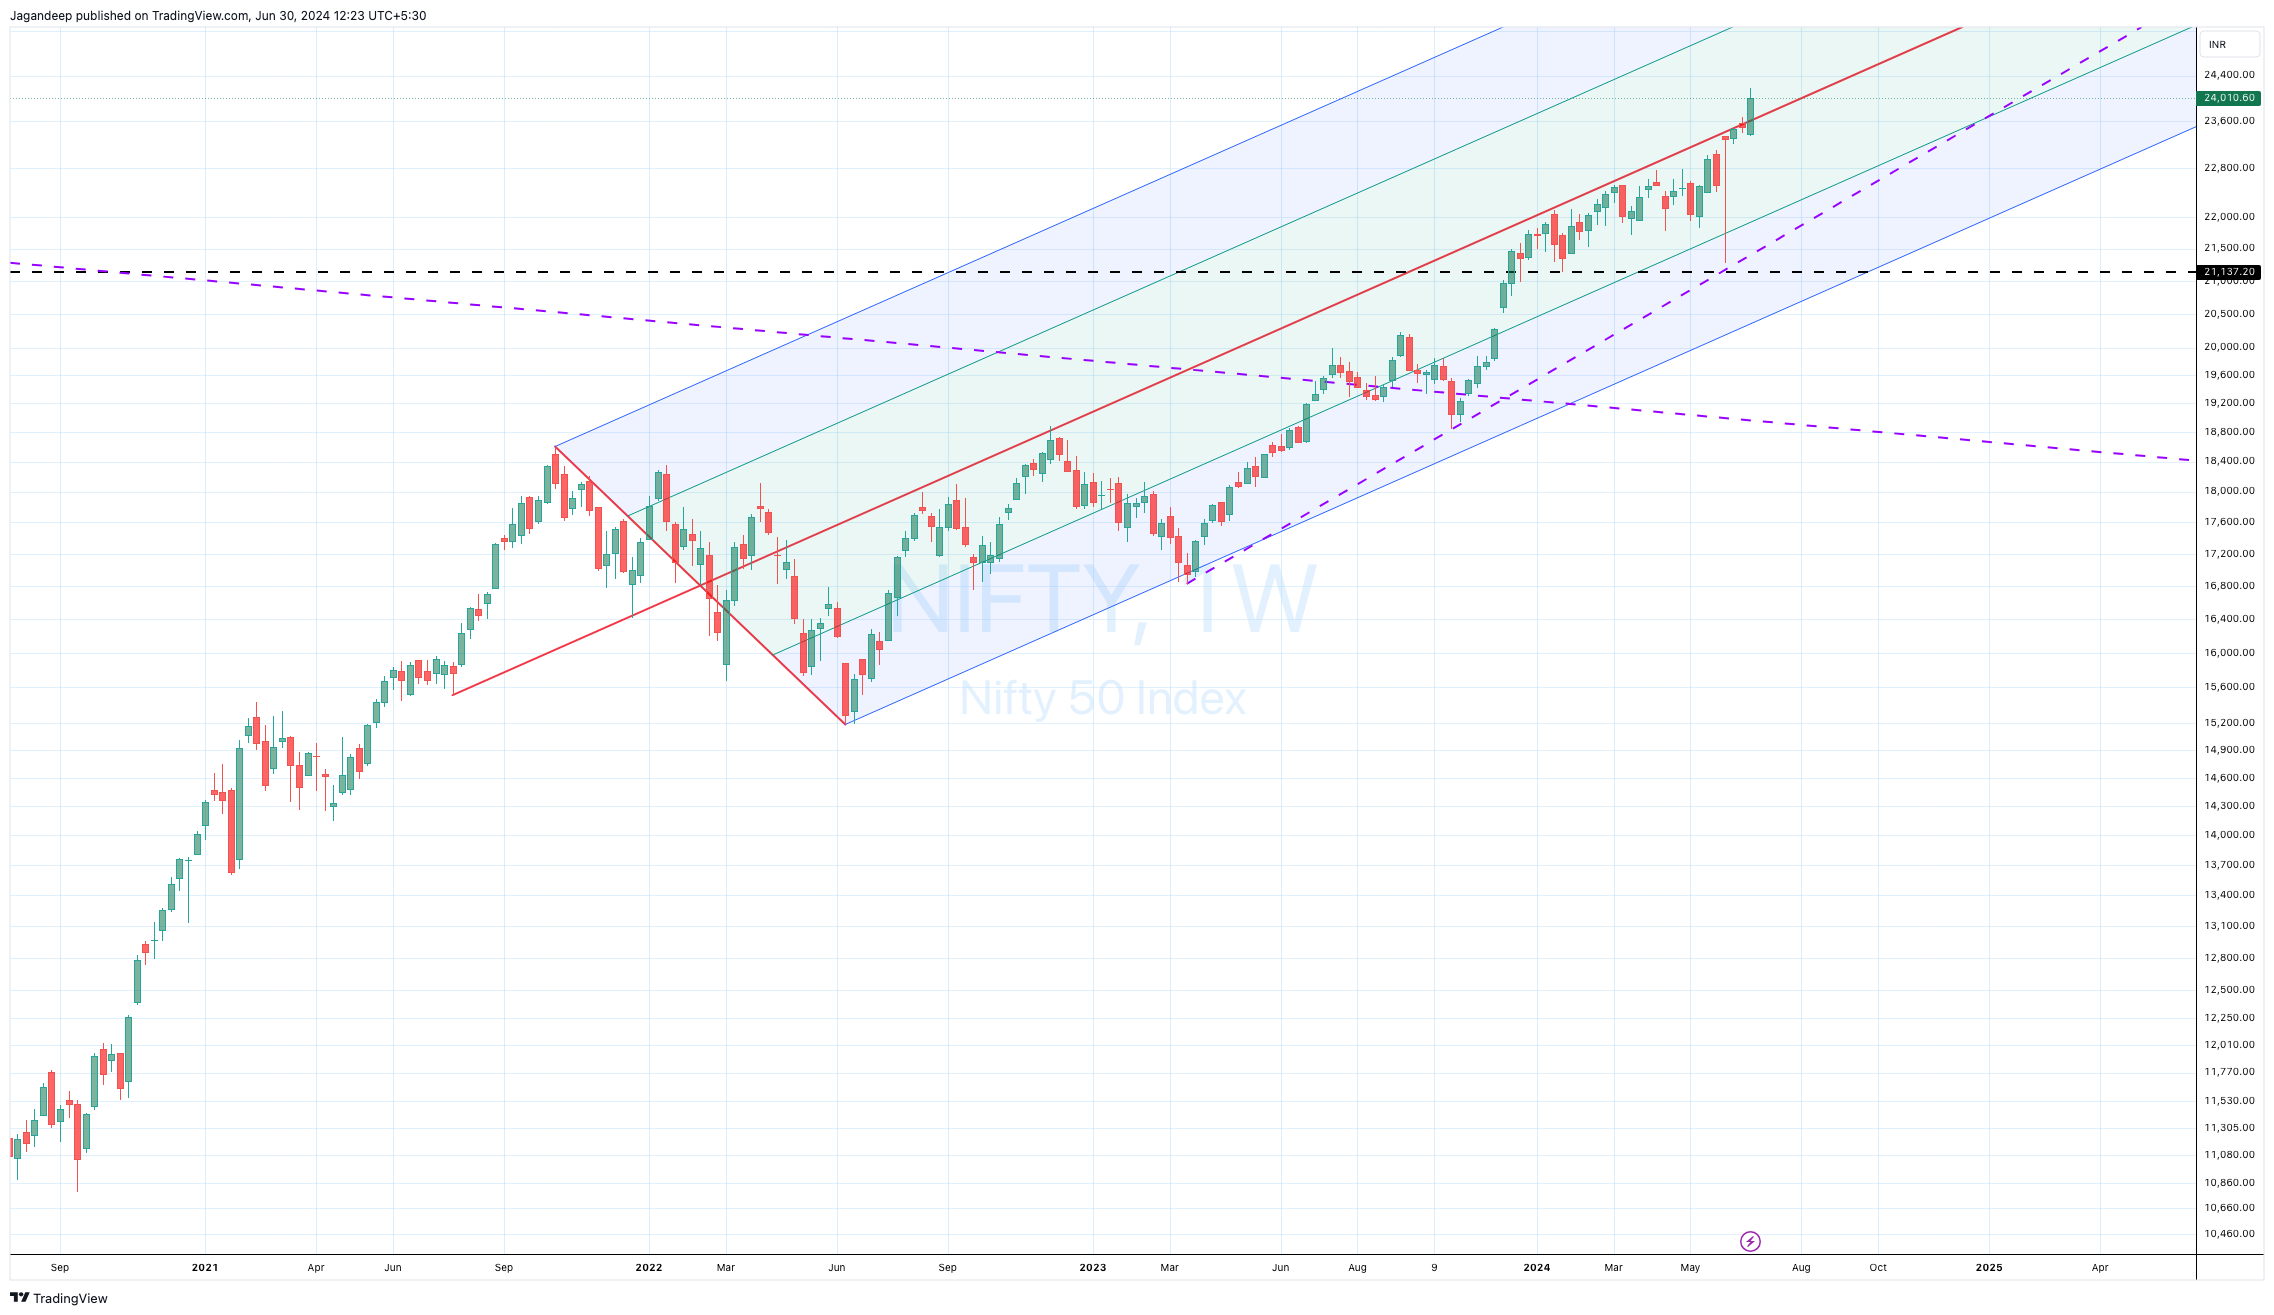
A breakout it is, on the NIFTY
The Pitchfork. The next pitchfork resistance is high 25000s - low 26000s.
NIFTY Weekly Chart
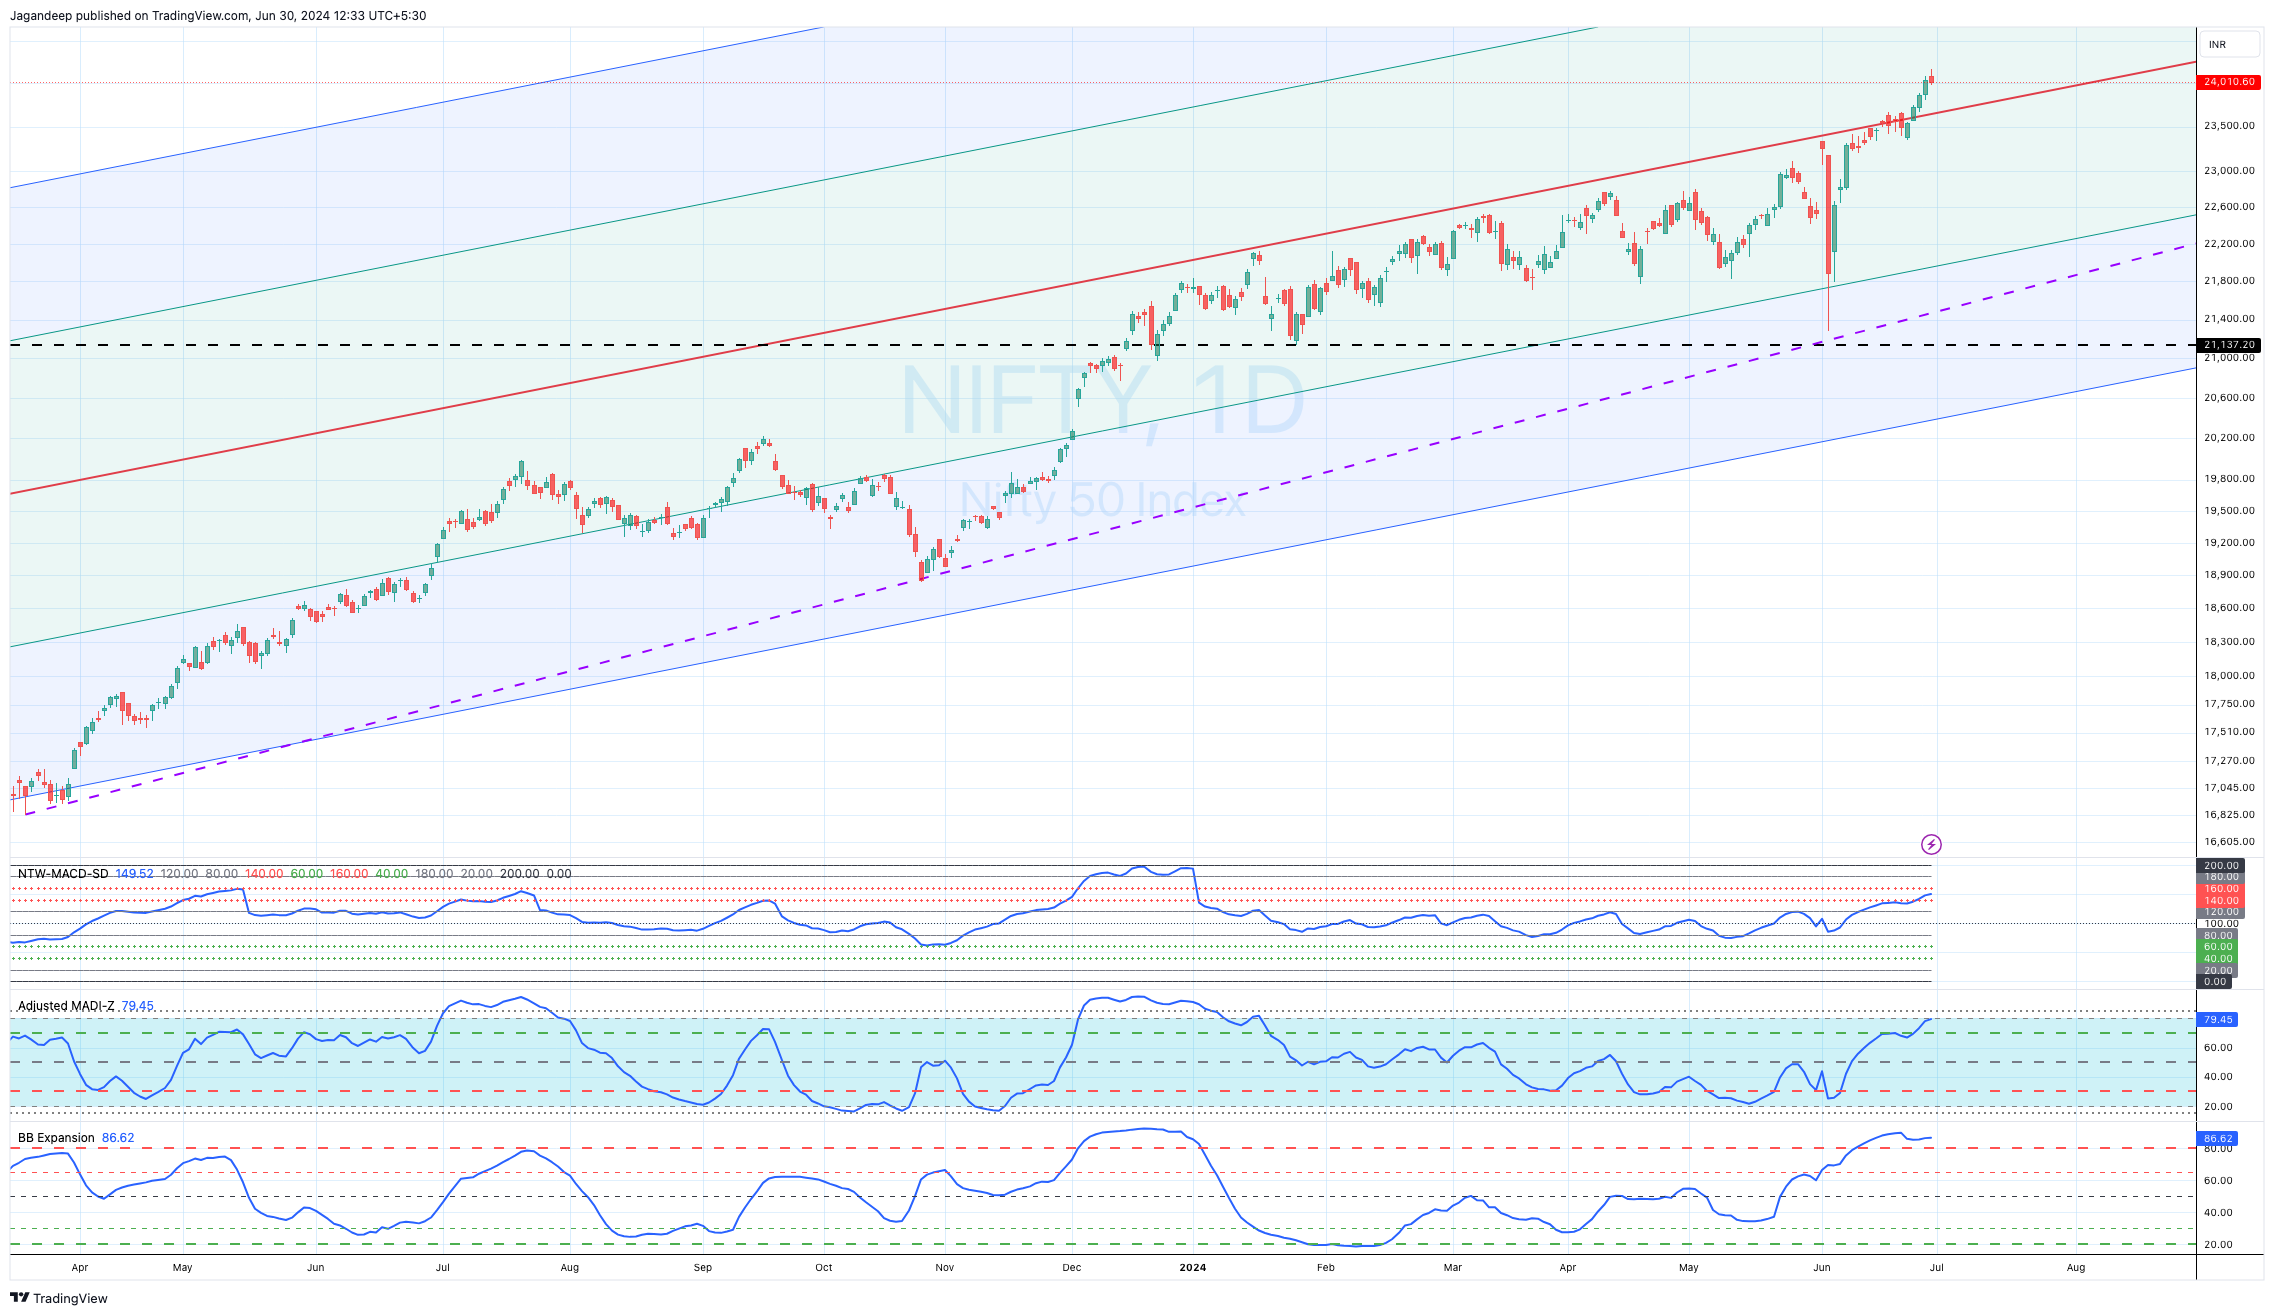
Below is the NIFTY daily chart with my custom derivative indicators (NTW-MACD-SD, MADI-Z and BB Expansion)
There is a definite breakout on NTW-MACD-SD (first indicator), whereas the MADI-Z (second indicator) has done a partial breakout at 70 and now needs to move above the aqua zone of 80 to show momentum building up further. This is the daily timeframe, and this is clearly bullish.
The Bolling Band Expansion Indicator is starting to touch an extreme, but that just shows that we either get vertical momentum, which pulls up the -2 SD higher, or we pull back. No specific worry here.
BUT … Isn’t there always one? And this is one to worry about. These are the same indicators on the Weekly time frame. The NTW-MACD-SD (first) is running into a momentum resistance at 2 Standard Deviation. On this one, MADI-Z indicates that the NIFTY is re-building its momentum after a pull-back to 70. The BB Expansion Indicator has also taken out the -1 SD to the upside and is now moving towards the mean (implying the move to the upside is fairly clear)
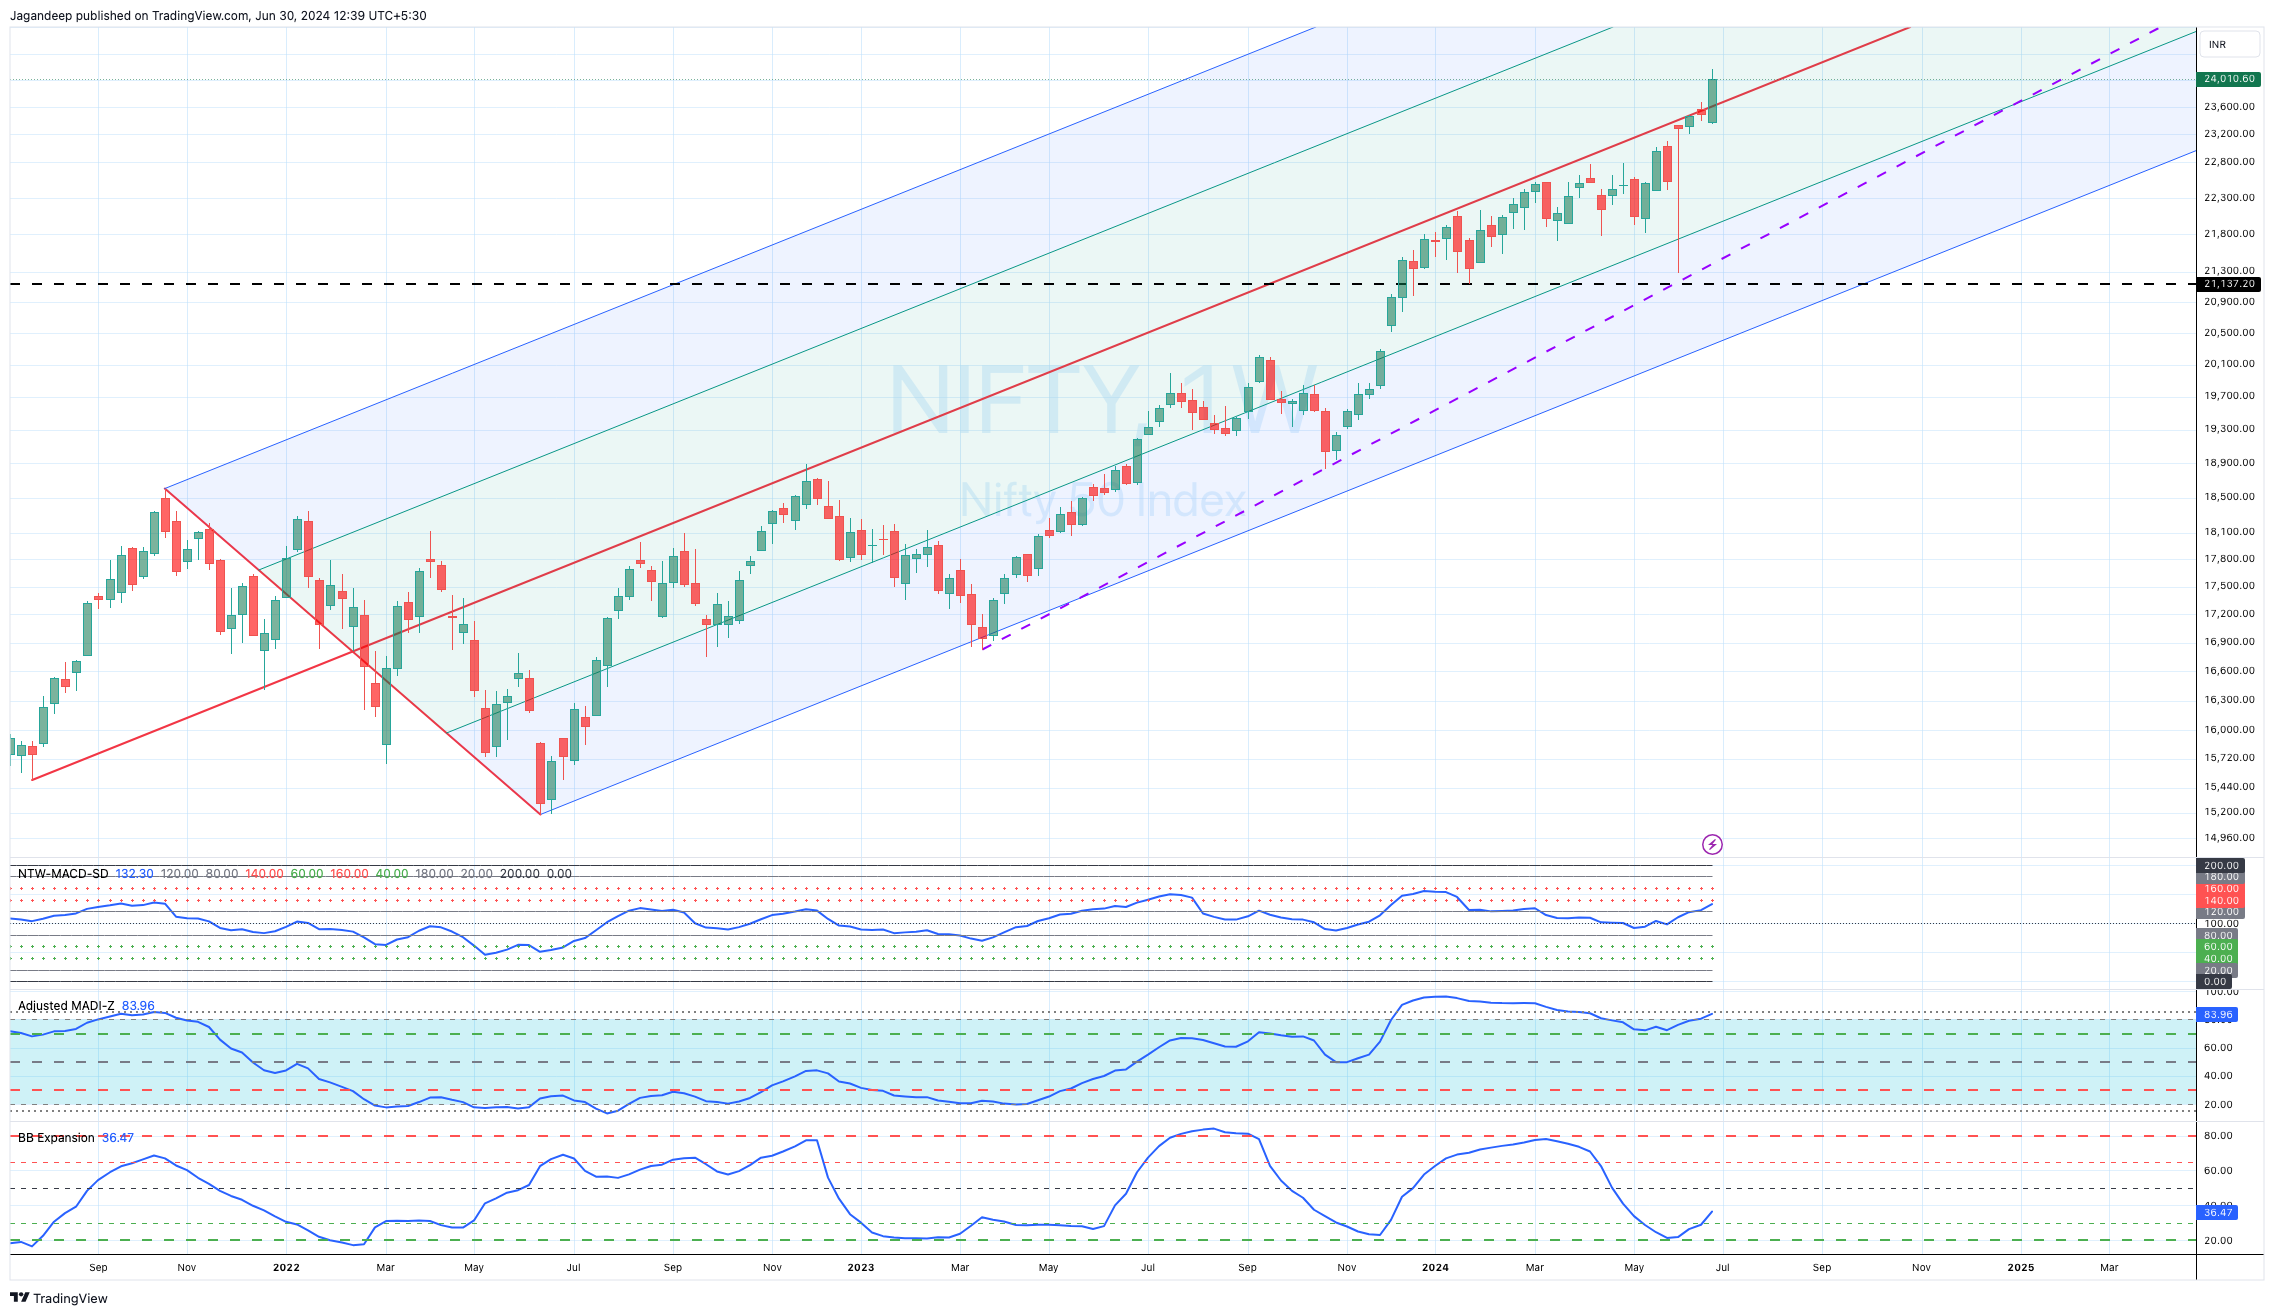
The past week was the first week after 20 weeks when the NIFTY tagged the +2 SD on the 52 Week Bollinger Band.
The 26-week rolling range on the NIFTY is 14.2% still much lower than the 10-year mediana and average of 16% - 19%. tops very rarely happen without the NIFTY hitting this rolling range. This also means the H2 range for the NIFTY is like to be at least 15%.
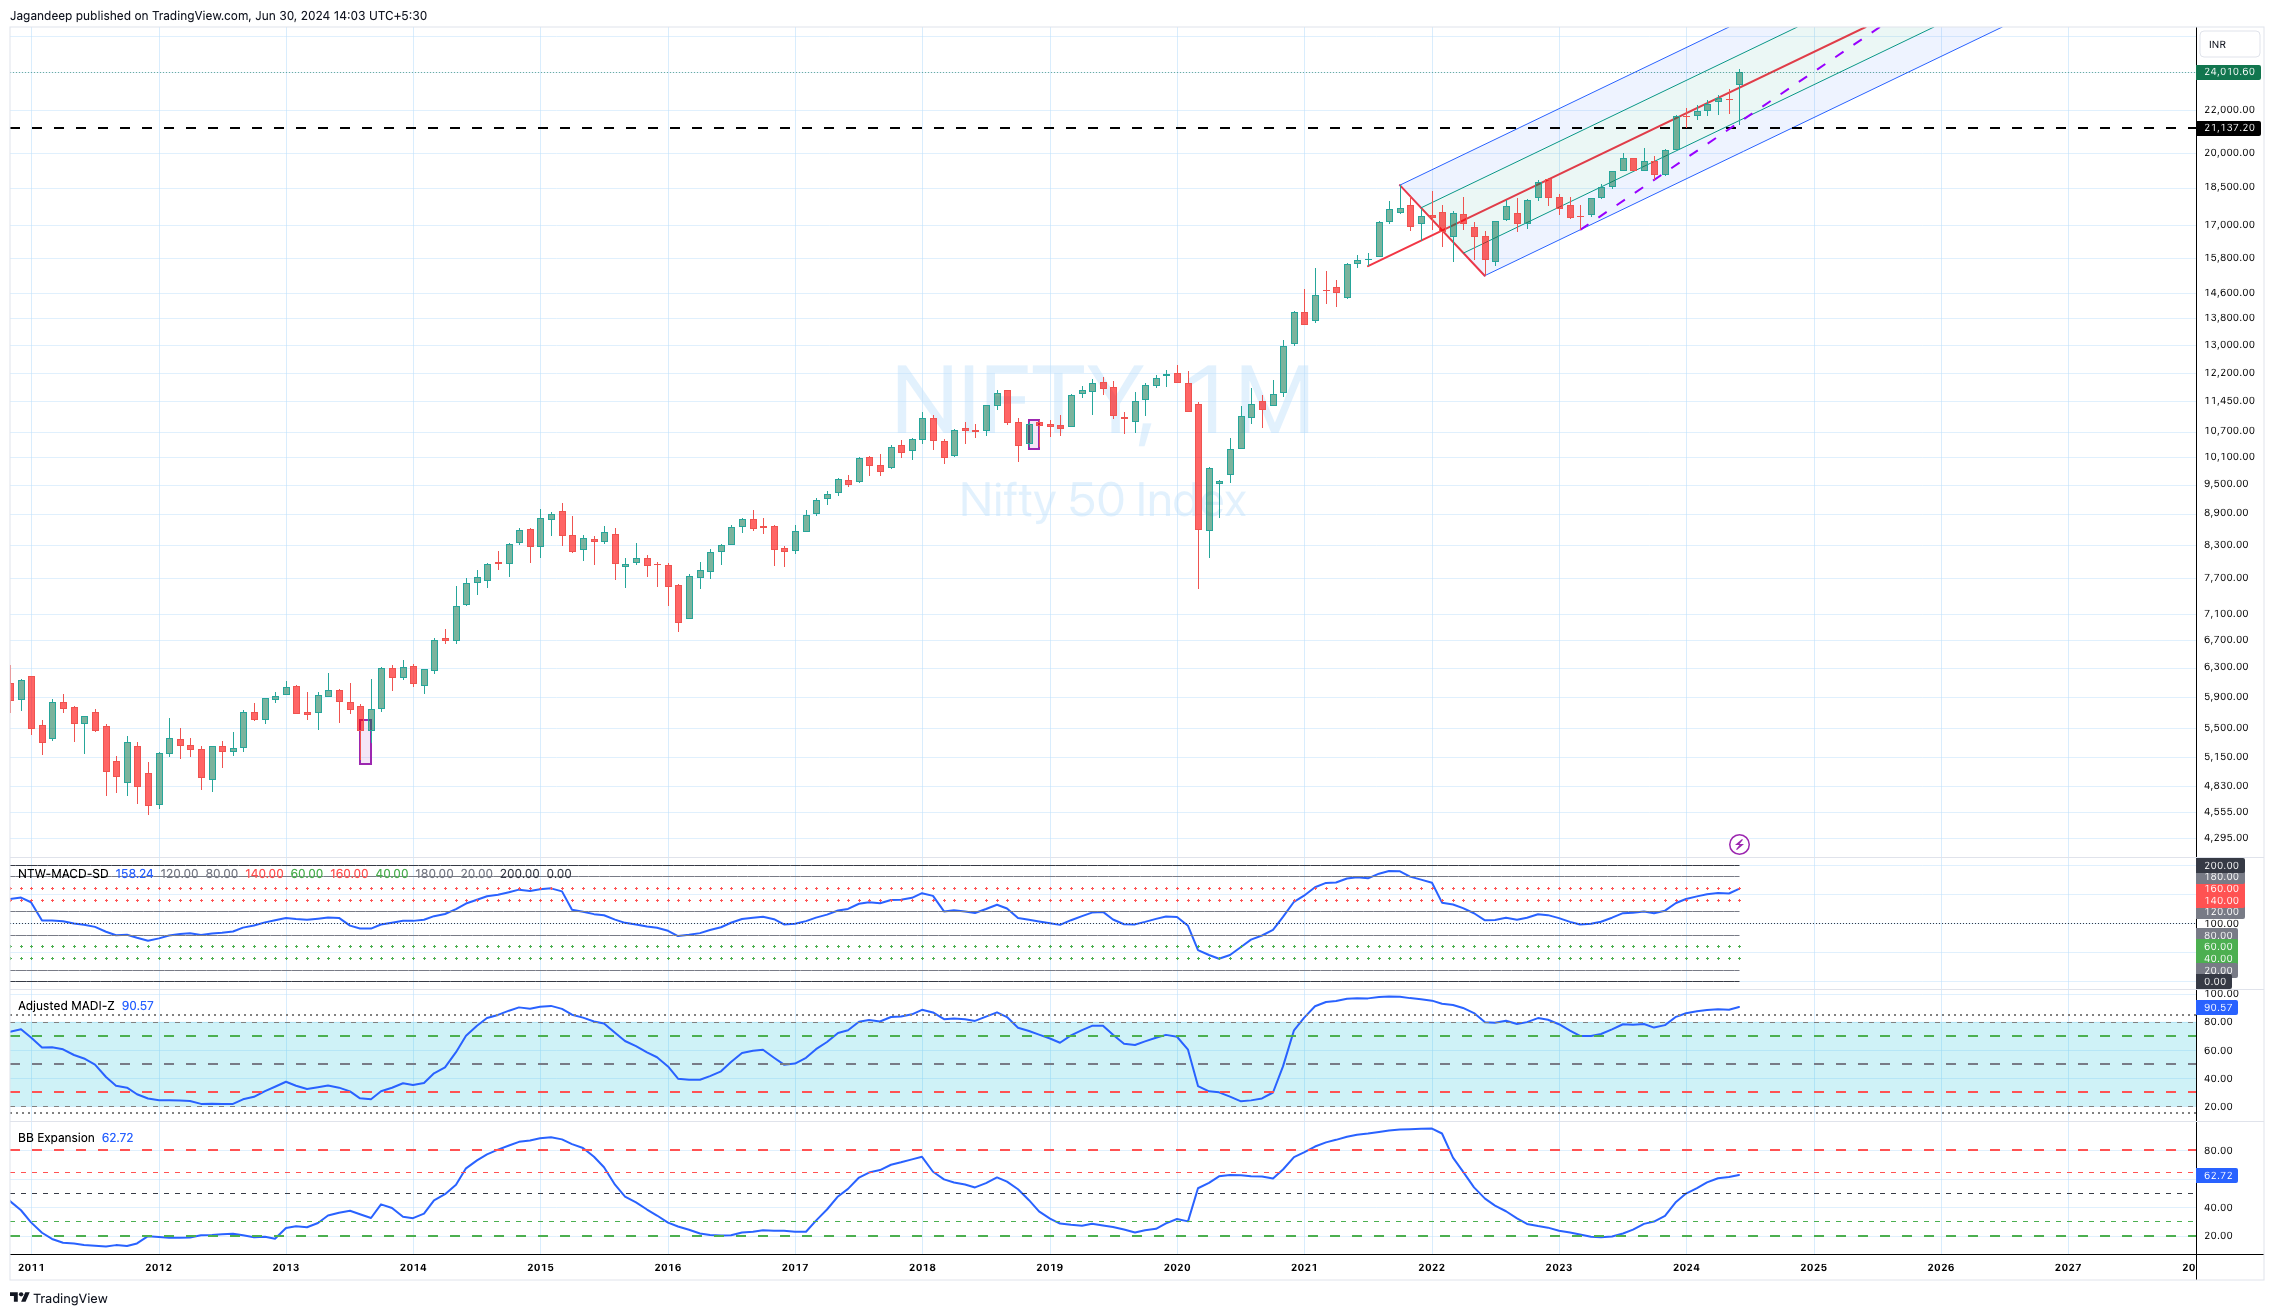
The Monthly chart is in. a beautiful trend, with momentum breaching 3SD at the end of June. The big Q is, will this sustain?
I expect this to create a momentum divergence (let us see if that happens)
This all looks good, so why the ominous start to the post? Let us now do a deep-dive into it.
A bit about the three custom indicators
NTW-MACD-SD is Normalized Time-Weighted MACD in a Standard Deviation format which is used to identify the quality of momentum. This is more long-term in nature and easier to decipher.
MADI-Z is Moving Average Divergence Indicator normalized with Z score is used to determine Trends vs Consolidation.
BB Expansion is a derivative of Bollinger Bands in an RSI format to determine expansion and contraction.
All these three indicators have some overlap but they fulfill different purposes. As you can see the NTW-MACD-SD has been in a broad consolidation for almost 3 years now, whereas MADi-Z has been more volatile. MADI-Z also shows the strong momentum in Q4 CY 2023 and early Q1 CY 2024. I like to increase or decrease my allocation depending on how these indicators align individually as well as a team.
Secondly, on these indicators the resistances and supports are the subsequent and previous standard deviations e.g, On NTW-MACD-SD (Daily TF), a 1 SD move on the NIFTY is somewhere between 3% - 4% move whereas on the Weekly TF, this is much higher.
The countdown to a top
There are two central tenets of my analysis.
History rhymes. The reason history rhymes is because of cyclicality in business and participant behaviour. From time to time, there are minor exceptions caused by liquidity and other factors, but they don’t last long.
At an index level, it is incredibly hard to make and continue to make all-time records i.e. have a fat-tail event and then continue to create fat-tail events again and again. This can happen at a stock level, but not at an aggregate index level.
Now, Let’s start to count why there maybe a top coming soon and where that top might be:
It has been 163 days since the -2SD was tagged on the Bollinger Band Daily. The previous highs are
164 days in 1999
175 days in 1997
175 days in 2007
218 days in 2005
229 days in 2004
454 days in 2017 - 2019 (The big outlier)
Remember, this happens a few or many more than a few days after the top has been made.
Moving Average Crossovers
It has now been 60 weeks since the 6 W-SMA went below the 26 W-SMA. This is the 3rd longest streak in history. The two longer streaks are at 80 weeks (2014 - 2016) and 84 weeks (2020 - 2022).
Remember THIS is also a lagging indicator. The 6 WSMA will drop below the 26 WSMA significantly after a top has been made.
The other combination is 13 weeks and 39 weeks (one and 3 quarters). It has now been 56 weeks since the 13 WSMA has been above the 39 WSMA. Major previous tops have happened between 61 weeks and 81 weeks.
The 10 MSMA has now been above the 20 MSMA for 45 months. This is now the 2nd longest streak in history. The all-time record on the NIFTY is 62 months between 2006 - 2009.
One of the things I track to understand contraction vs expansion is where the price is relative to a Moving Average.
The NIFTY tagged the +/-2% range around the 10 WSMA for a record 21 weeks, and then it broke out.
From the lows of the last tagged candle, the NIFTY makes a move of between 15% - 25% after such a tag. Good News?
Actually, no. The low of the last tagged weekly candle was 21287 (Yeah!), and we have already made 13.6% of the expected 15%—25% move.
The minimum target for this move is around 24,5K and the upside is in the high 26000s
The NIFTY has now made 9 consecutive Higher Highs on the Monthly charts. The only longer streaks?
11 months in 2015 - 16
12 months in 2005 - 06
14 months in 2017 - 18
REMEMBER: This is the canary in the coal mine. It would be the first point to note if the NIFTY stops making a Higher-High on the monthly time frame. The next one would be breaking below the last month’s low
The ending of such a streak is followed by at least an 8 - 12 week correction. The operative word here is “at least”.
The standard monthly RSI has been above 50 for 48 months and is also now above the level of 80. Historically. the previous longest streaks have been
48 months between 2015 - 2019
60 months between 2004 - 2008.
Remember: This is again a lagging indicator. A top will happen much earlier.
This is now an All-time record for durations between two back-to-back 20%+ corrections. [Have also highlighted this in my previous posts]
There is also the curse of the Indian General elections (Twitter Thread here)
In the 2 - 10 months after the general elections in India, the markets have seen an average correction of 29% from the top.
Data cross all elections from 1996.
Elections in May 2019. Top in Jan 2020. Correction - 39.58%
Elections in May 2014. Top in Mar 2015. Correction from the top is 25.15%
Elections in May 2009. Small top in Jan 2010. Correction from the top is 11.97% [This is an outlier primarily because we were coming of the insane correction in the GFC)
Elections in May 2004. Tops in May 2004 and Mar 2005. Corrections are 35.8% and 13.97%.
Elections in October 1999. Top in March 2000. Correction - 52.08%
Elections in Feb 1998. Top in April 1998 and correction of 35.08%.
Elections in April 1996. Top in Jun 1996. Correction is 31.7%
The reasons for these corrections/bear markets vary from year to year, but one of the potential seeds of these corrections lies in the significant rallies in the months prior to the elections.
The NIFTY has also now seen five consecutive quarters of Higher-Highs. Previous records:
6 consecutive quarters in 2017 - 18 and 2020 - 21.
7 consecutive quarters in 2004 - 06 and 2009 - 10.
The NIFTY has also now done five consecutive green quarters (Close > Open). Previous records:
6 consecutive quarters in 2013 - 15 and 2020 - 21.
7 consecutive quarters in 2009 - 10.
There are numerous other parameters which are coming together.
A few days back a friend asked me: How I see the next 3 - 5 years and I said I expect three types of corrections
A 10%ish correction - Possibly done now on 4th June.
A 20%+ correction
A 35% - 50% correction.
Now, the way data is coming together, there is a very good chance that the 20%+ correction is around the corner. There is a reason I used the word count-down because this is a literal countdown.
The following is the conclusion from my last post, and it is the one that is already playing out.
Conclusions from the Analysis
Most Likely (Probability - 50%)
The difference between the most likely and least likely scenarios is pretty minuscule, primarily because we need more data to confirm this.
This is also seasonally a time when the markets rally.
At this point, if and when, the range break happens it is most likely to the upside (Why? It is just the path of least resistance).
There is no fundamental reason for this upside move, but sometimes, the reasons become apparent in hindsight.
The new leadership could power the NIFTY to the upside (while the old leaders consolidate) because they see money flows and better acceptance. So, I’d look for sector index momentum to get a better idea.
If this move pans out, the targets for this rally are 25.5K—27K on the NIFTY. This move could start immediately or within the next few weeks. Timeline for the move (Next 2 - 4 months)
Conclusions from the Analysis
Most Likely
For the moment, we continue upwards. We are amid the final upmove before a major correction sets in.
The targets for this upmove are at minimum 24500 (and not 25500, as in the last post), but it is still very likely that we hit 25500 or higher.
If the break-out fails here and now, that should herald either an immediate top or a top in the very short-term.
The next top will be a major one, and a retracement should come, unlike what a lot of new speculators have seen (20%+ on the NIFTY Index).
Now, such moves don’t happen without global black swans or even major local black swans (like Sarkar’s stability having issues)
The time of this top is between now - and March. I know this is a very wide range, but we need to see more price action to determine when this will happen.
My base case is the top happens between August - November but this will need more data to clarify further.
Remember not everyone gets to go out on a high. Don’t push your luck in this “The Last Hurrah”.
Less Likely
The Breakout fails, but the NIFTY doesn’t breakdown and continues to consolidate.
The analysis is meant to be foremost a journal of my analysis. Consider it as such and use it for your analysis. I’m not a SEBI-certified market analyst (Hope to be one, some day). I also post market analysis on twitter with the handle @SeldonOnMarkets