The last five weeks have been a story in two parts. The NIFTY moved from 24753 on 06th September 2024 to 26277 on 27th September. AND THEN …. five days later, the NIFTY was back down to make a low of 24966.
Thanks for reading Seldon on Markets! Subscribe for free to receive new posts and support my work.
The interesting thing about this move is the complacency the last move engendered. Despite my analysis, yours truly had started to wonder and think we were in the beginning stages of a blowout on the markets. I wrote on one of the forums, and that was an erroneous view, that we were in the beginning to middle stages of a blowout and would gather momentum to the upside. Of course, it didn’t, and this was a lesson in getting swayed by the price. As the data below shows, 26250 - 26500 was an expected pit stop for the move, and I was too hasty (or greedy) to think otherwise.
Let us do a quick status check.
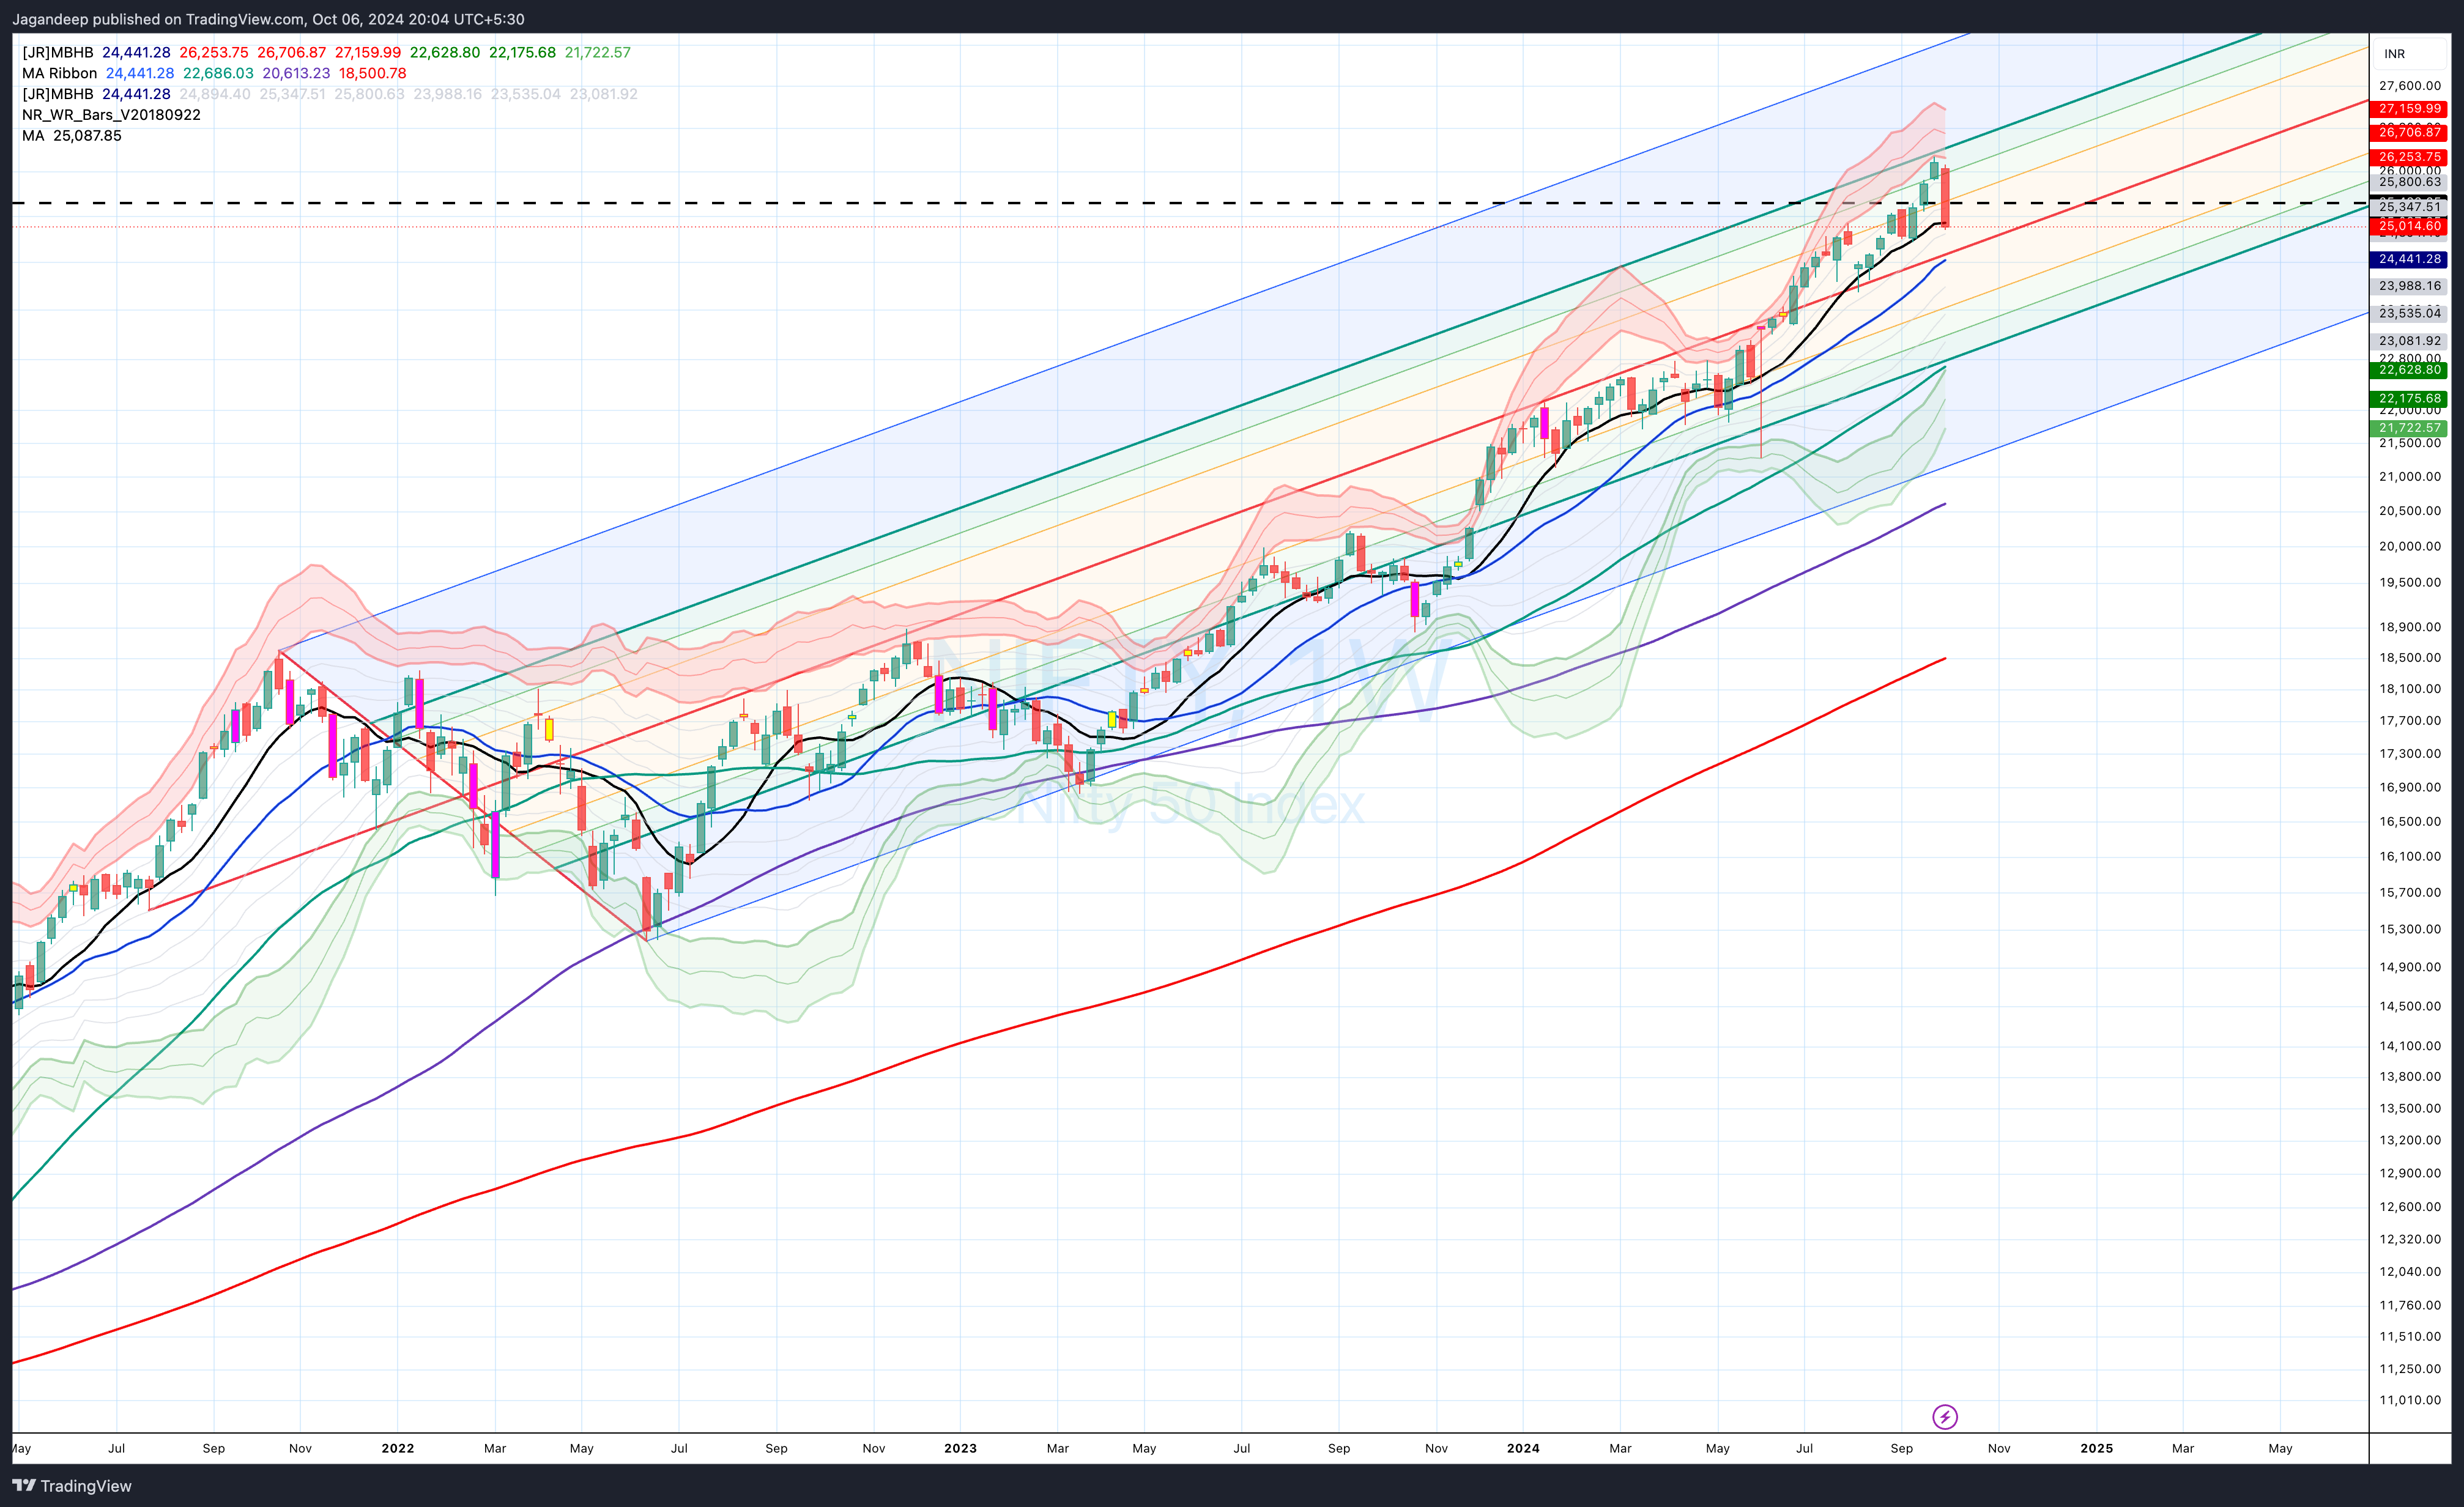
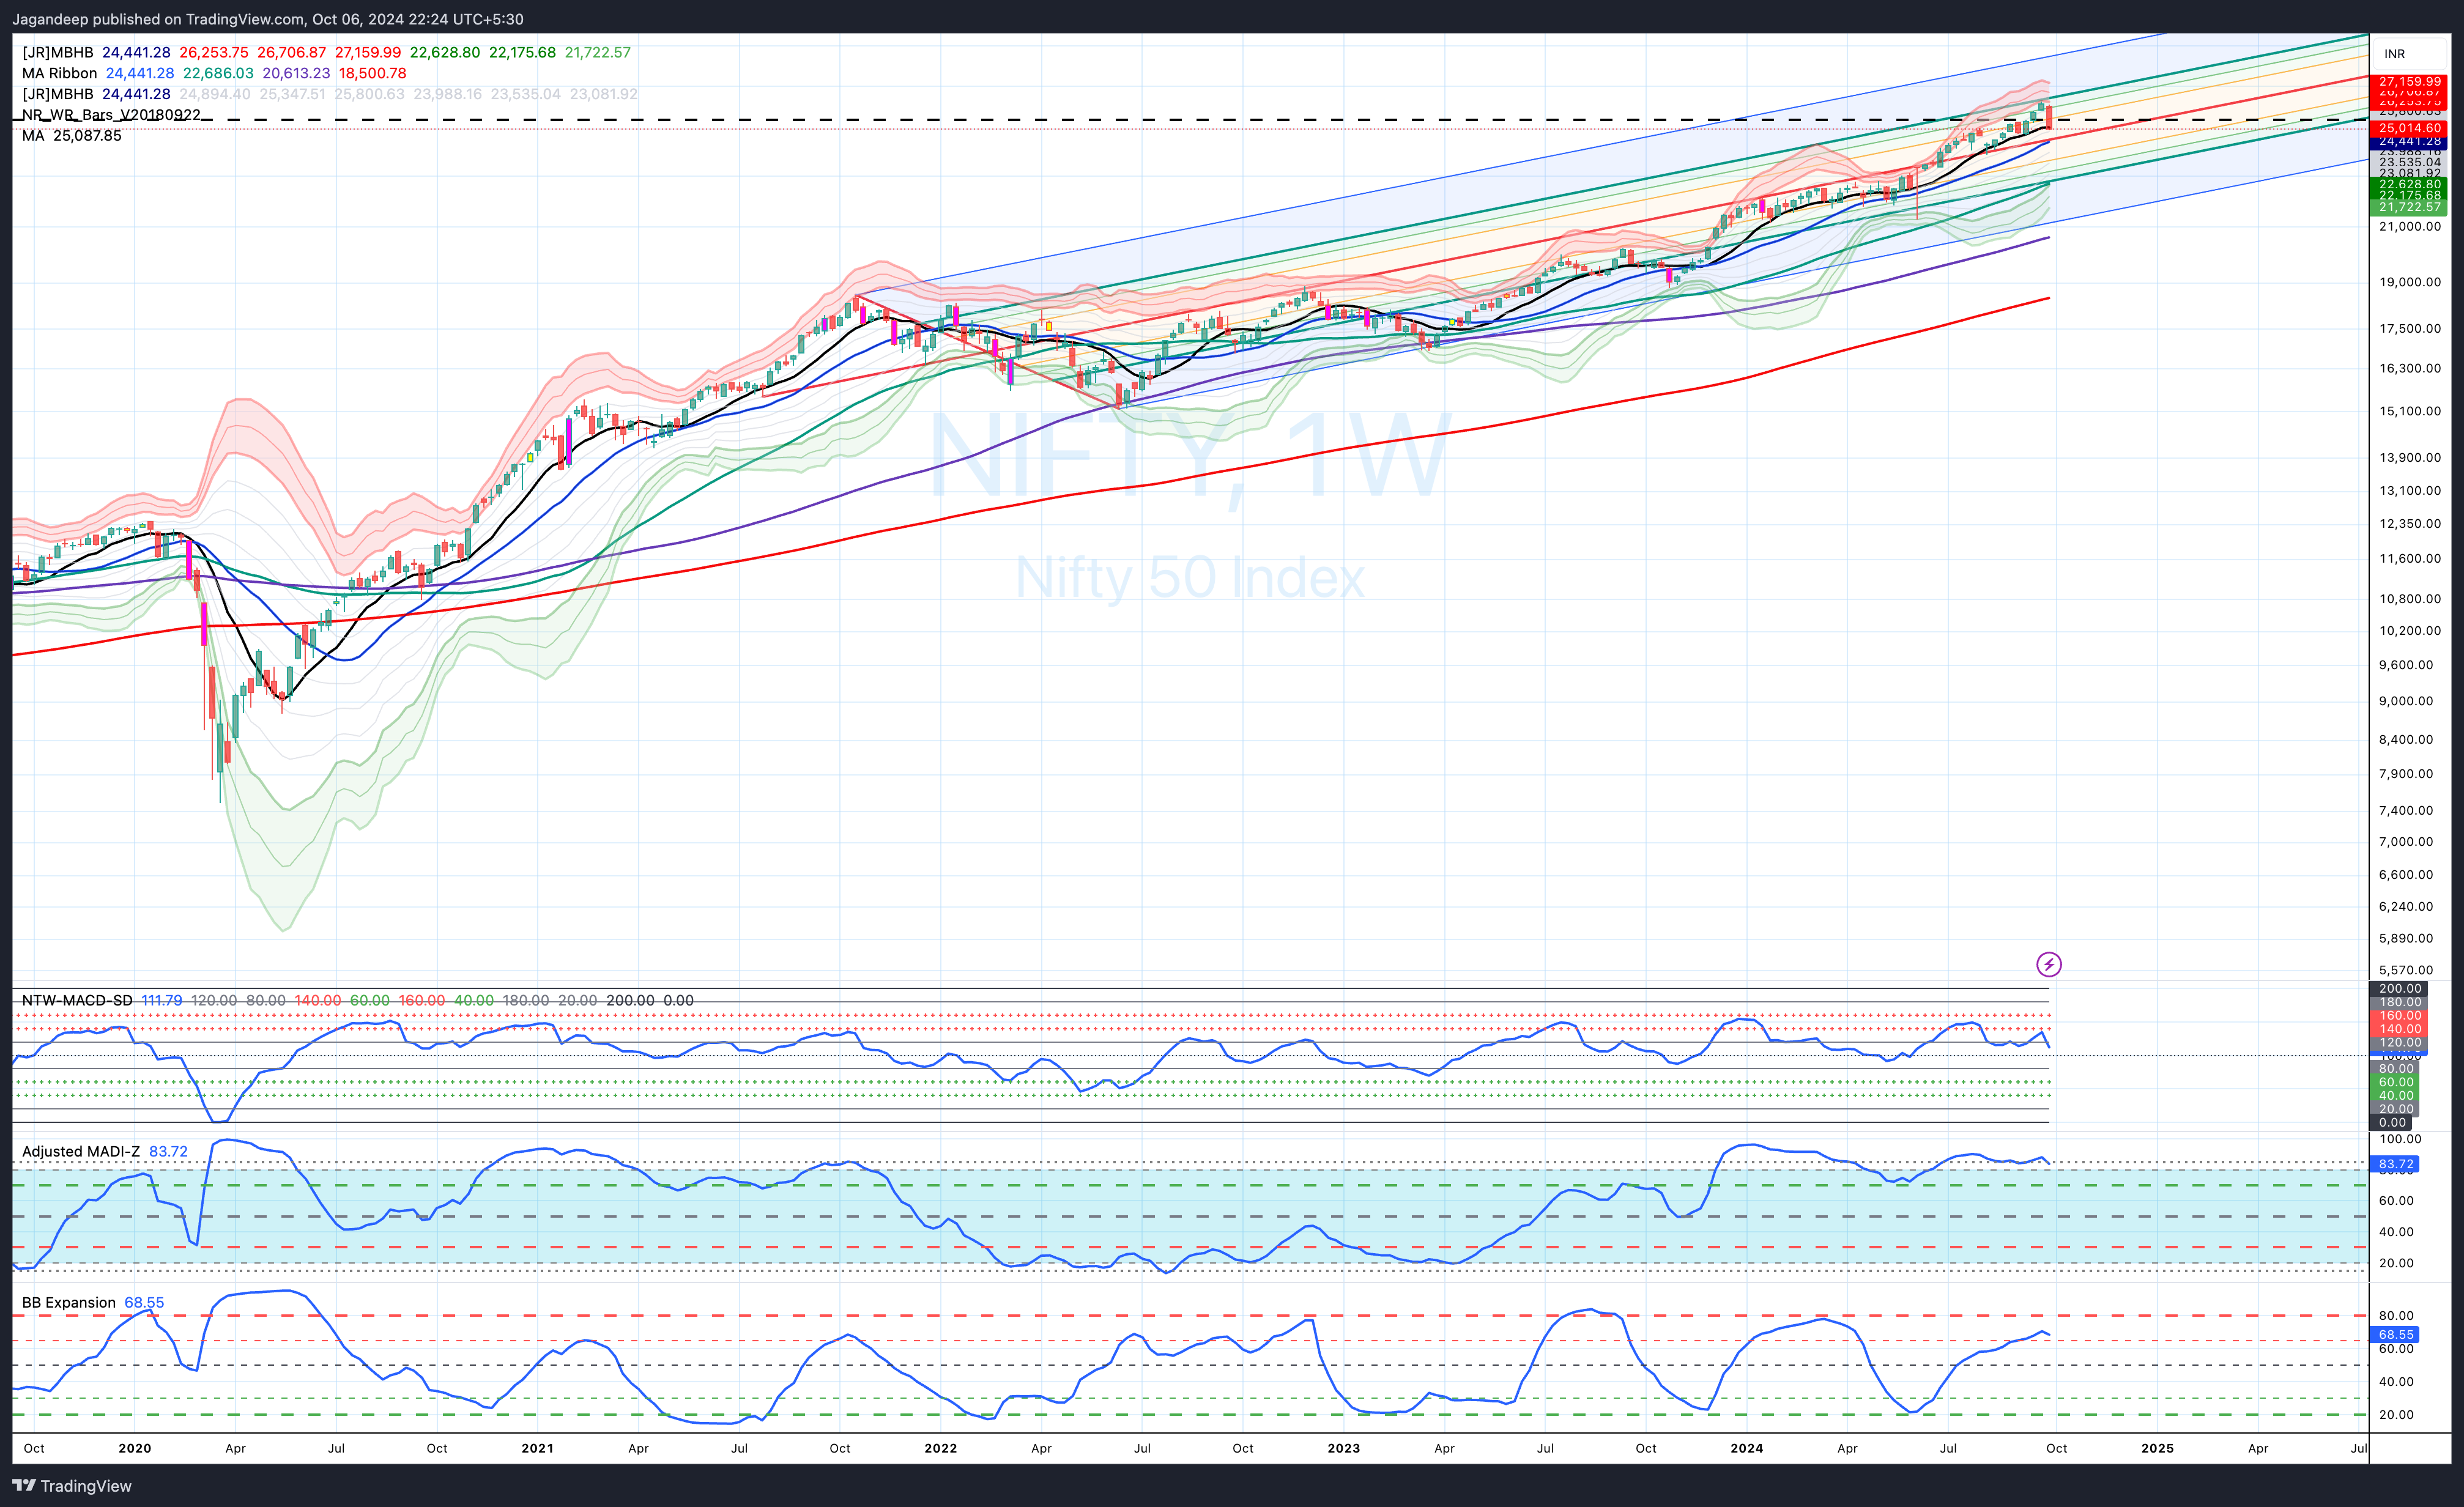
I’ve been talking about this stunning pitchfork for months, and of course, the target was hit, and we have seen a correction of precisely 5.00% so far. [Weekly Time frame chart for the NIFTY]
Note that this correction is now reverting back to the start of the breakout (the pitchfork middle line). This is also a level that holds the 20 W-SMA. The range of 24450 - 24700 should be a natural point for this correction to meet significant support.
Another follow-up: The Anatomy of the Next Correction
This is a portion from my 4th August post, “Is this the top”, titled “The anatomy of the next correction”.
Assuming the above doesn't happen, the NIFTY’s price action associated with large correction will proceed on some variation of the following steps
Stop tagging the +2 SD on the 26W Bollinger Band.
Take support in the first correction at or near the 10WSMA, or, in the worst case, near the 20WSMA.
Bounce back and lose momentum. Either make a very tepid new high or don't even make a new high.
Depending upon (2), either slow down at 20WSMA or take it out to the downside.
Fall and pull back, but not exceed the previous swing high (e.g., look at what happened in 2015 - 2016 or 2021 - 23).
Break the previous low and continue to make lower highs and lower lows.
The moving average or the indicator periods may differ, but this will be the broad outline of how any major correction will play out.
The Steps from 1 - 4 are almost done now. Another 1% - 1.5% would mean the 20 W-SMA has been tested. This is the FIRST POINT at which the Weekly time frame is starting to take a hit. The next upmove will determine how quickly the next fall will be. If the 20 W-SMA is not taken out this time, then I’m willing to bet that it will get taken out during the next bout of correction. This is the start of the translation of weakness from the Daily Time frame to the Weekly Time frame (which is essential for a significantly significant correction).
You might wonder why I think the Daily Time frame now radiates weakness to the larger time frame. Well, look at how the last correction of < 5% took support at the 20 D-SMA, and the next correction has exceeded the previous correction and has also now tested or taken out the larger MA, i.e. the 50 D-SMA. This DOESN’T happen when the market is strengthening momentum. The NIFTY has not taken out the 100 D-SMA (approx. 20W-SMA) since October 2023 (ALmost 11 months ago) (except for that one day on the 4th of June.
The Analysis
Daily Time-Frame
Unless we see a stunning momentum-driven pullback beyond the current ATH (as fast as or faster than the fall), the daily price action's relevance to the larger time frame action is pretty much done.
Let’s still take a look at the data for this time frame.
Bollinger Band Analysis
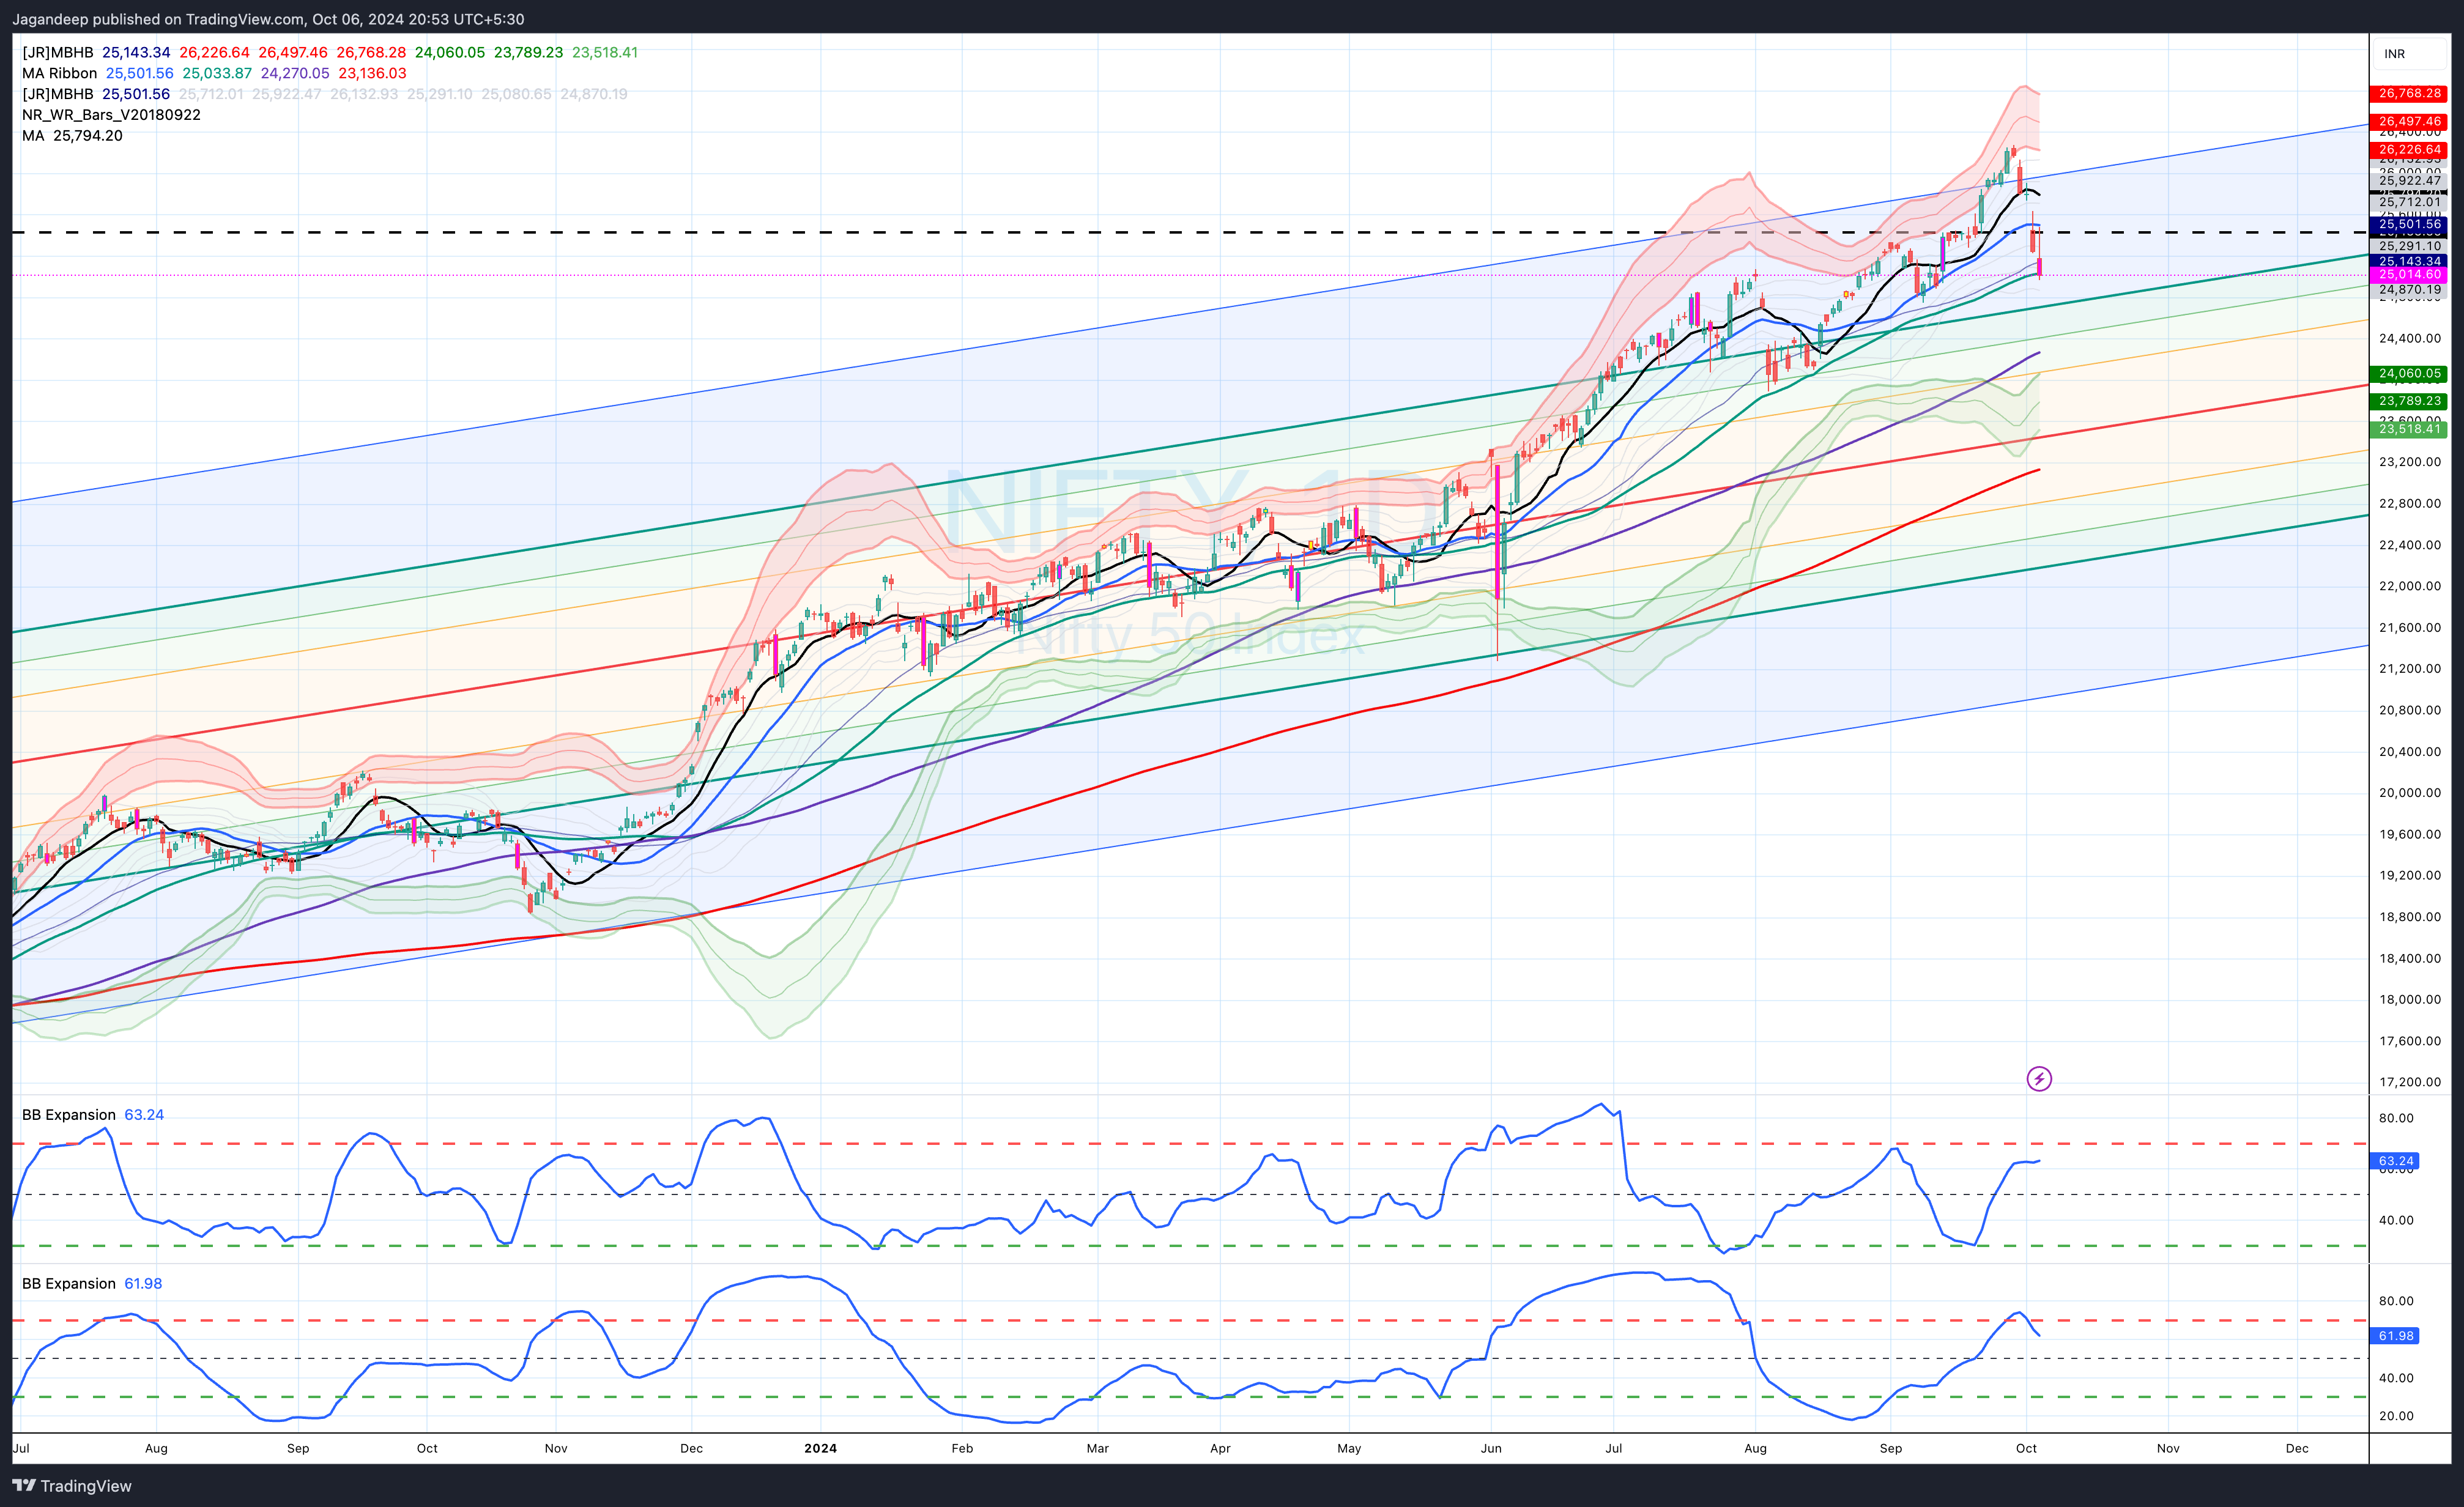
One of the things I do is utilize the Bollinger Bands across multiple periods (after all, they’re essentially just price and Standard Deviations). On the Daily time frame, I use 20 days (one trading month) and 40 days (two trading months) [Refer chart below]
On the 20-Day Bollinger band, there is still some space for the market to expand, whereas,
On the 40-Day Bollinger Band, the expansion cycle seems to have been completed and indicates a contraction of the bands is coming up.
24650 (approx.) is also the -2SD on the Daily Time frame (20 Day) Bollinger Band [Another point of support]
Point to Note
This is now the 2nd longest streak, at 230 days, for the NIFTY between consecutive tags of the -2 Standard Deviation (40 days), The only longer streak is 453 days.
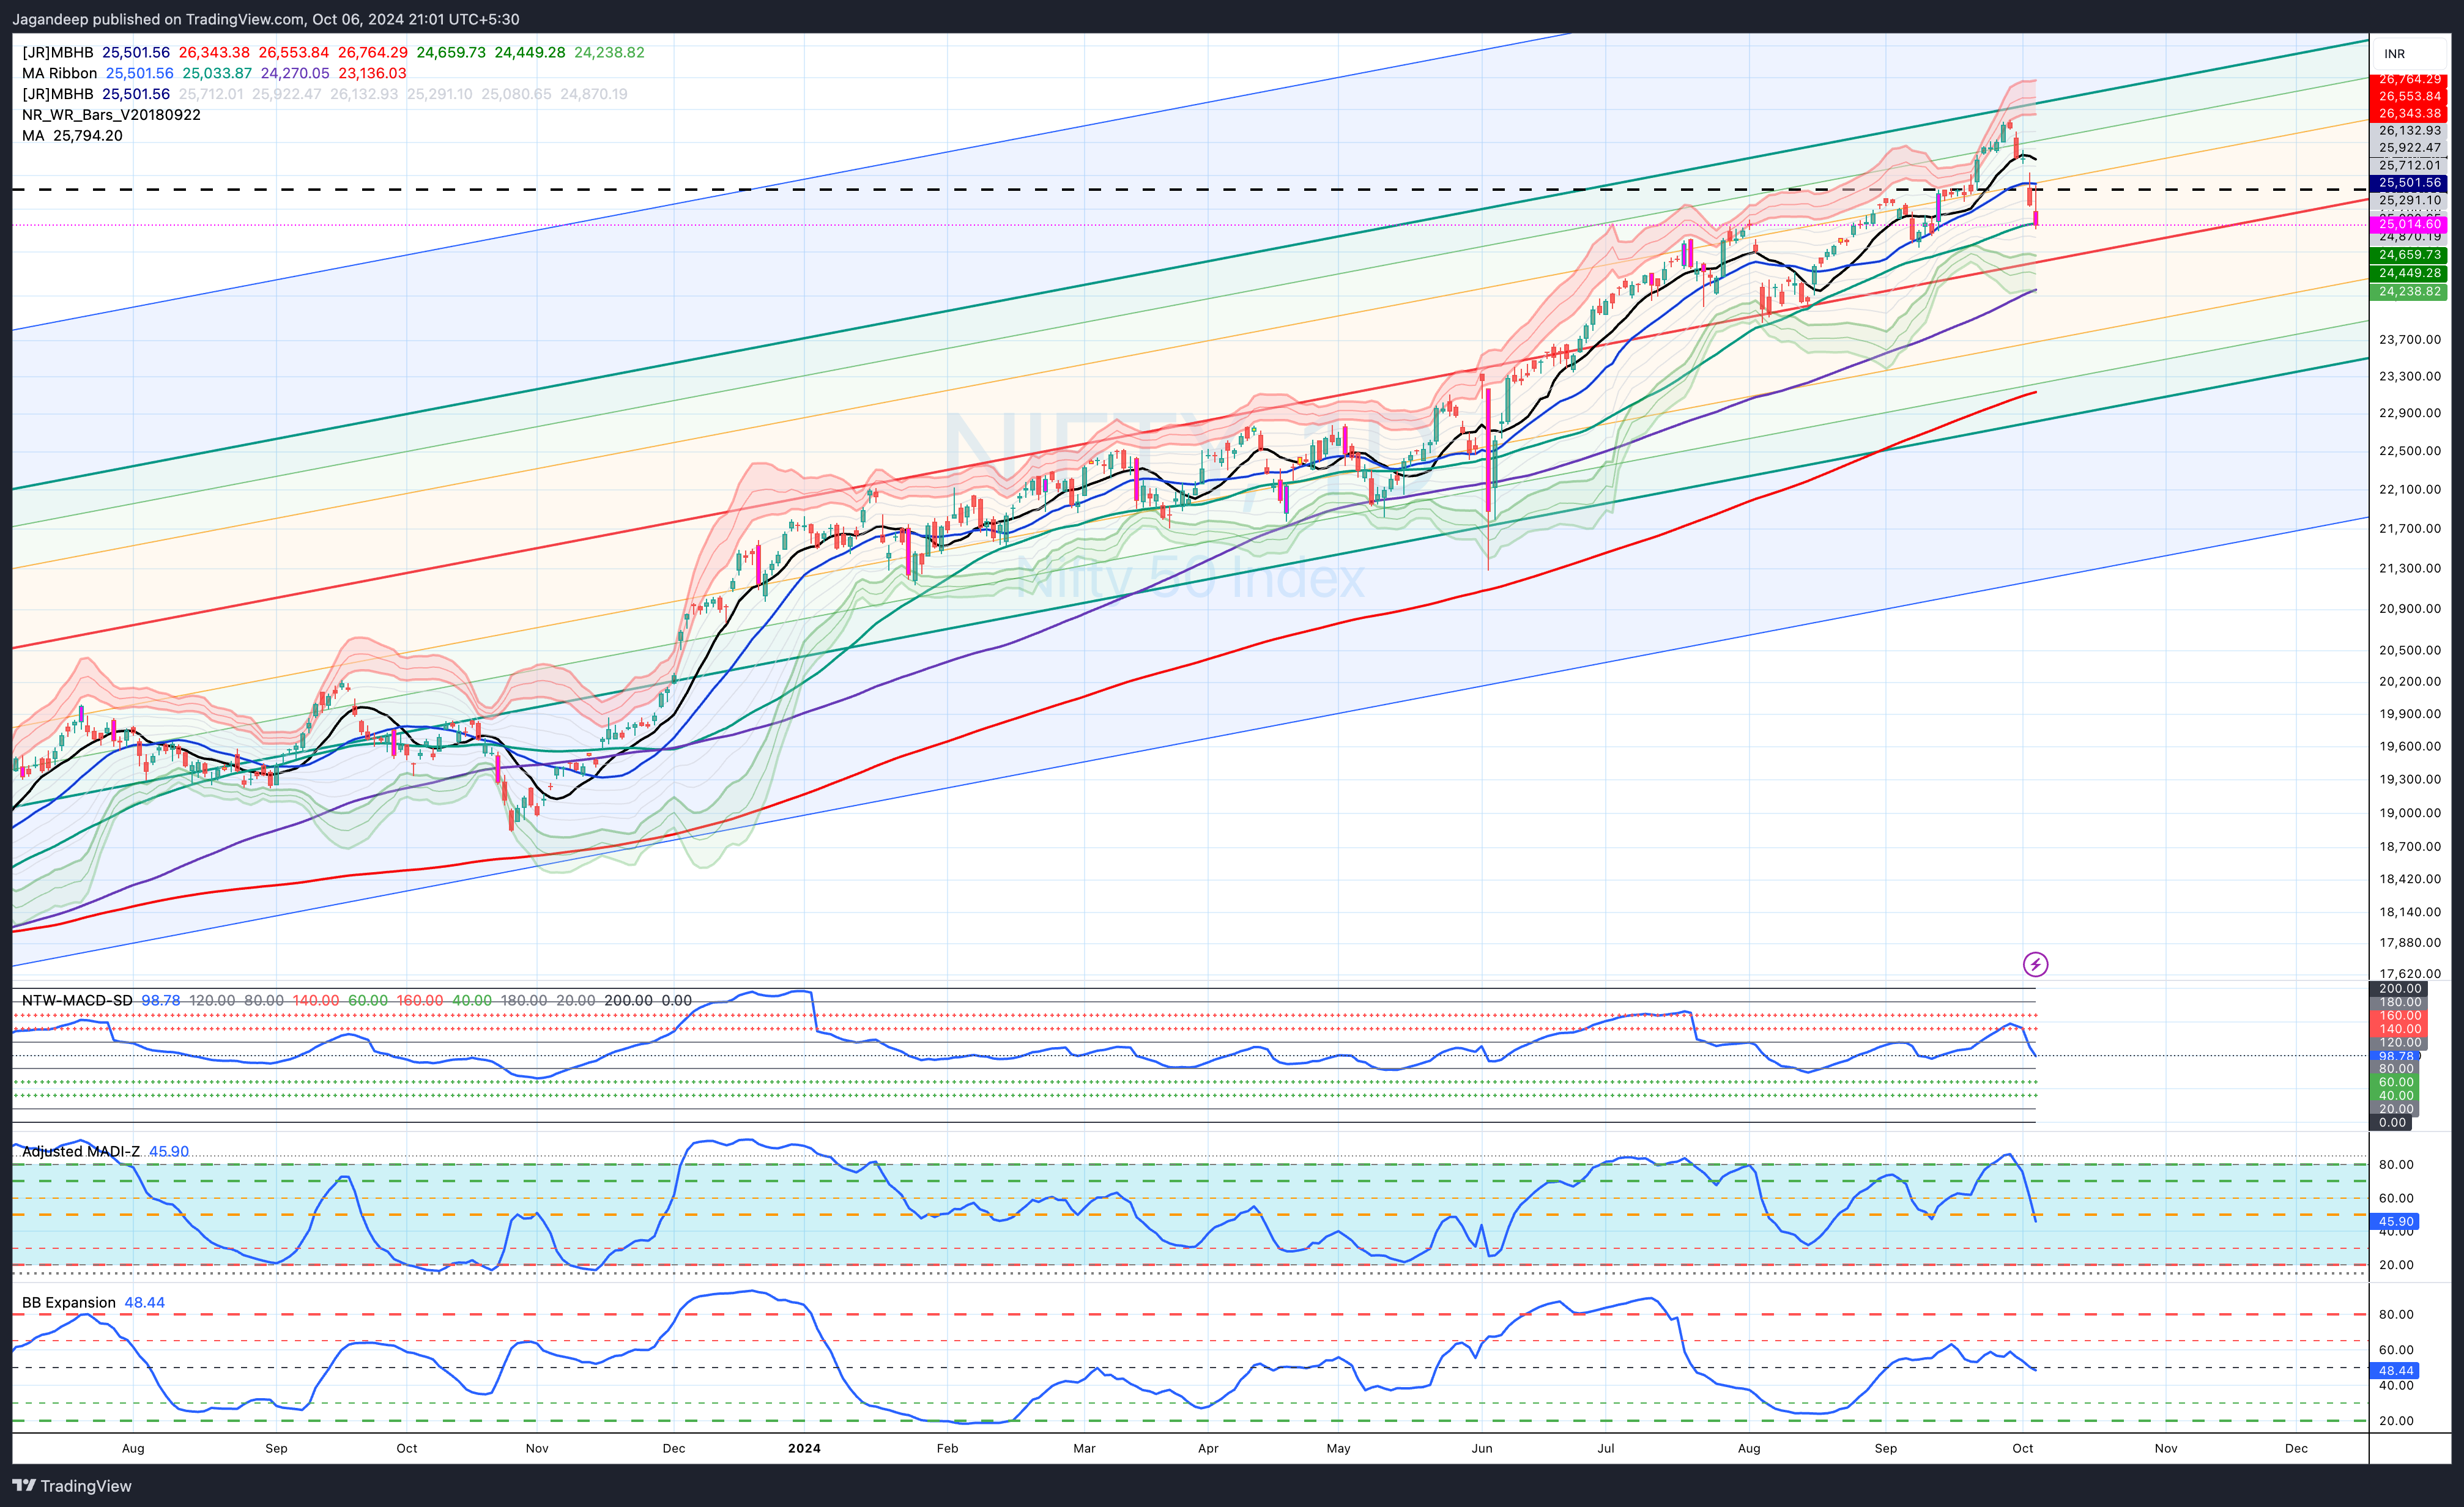
Momentum has stalled across multiple indicators. This has happened at momentum resistances (Refer to chart below). None of them indicate an immediate speedy reversal. All of these indicators can fall further while the market consolidates.
Moving Average Analysis
One way to determine price and time extremes is to evaluate how moving averages behave relative to each other.
During the last correction, the 10 D-SMA completed its pullback to, and below, the 20 D-SMA.
It has now been 211 days since the 20 D-SMA went and closed below the 50 D-SMA. The all-time record is 223 days.
Now, if this cycle has to be completed, then that means the NIFTY won’t make a major upside move for at least multiple weeks.
The NIFTY could either consolidate for a while (multiple weeks) OR even correct lower at pace (so that the Moving Averages get pulled together).
I will be extremely worried if the NIFTY breaks the 25450 - 24700 level with any momentum.
Weekly Time frame
This is the time frame to watch because the weakness in the Daily time frame is starting to translate into this time frame.
Bollinger Bands
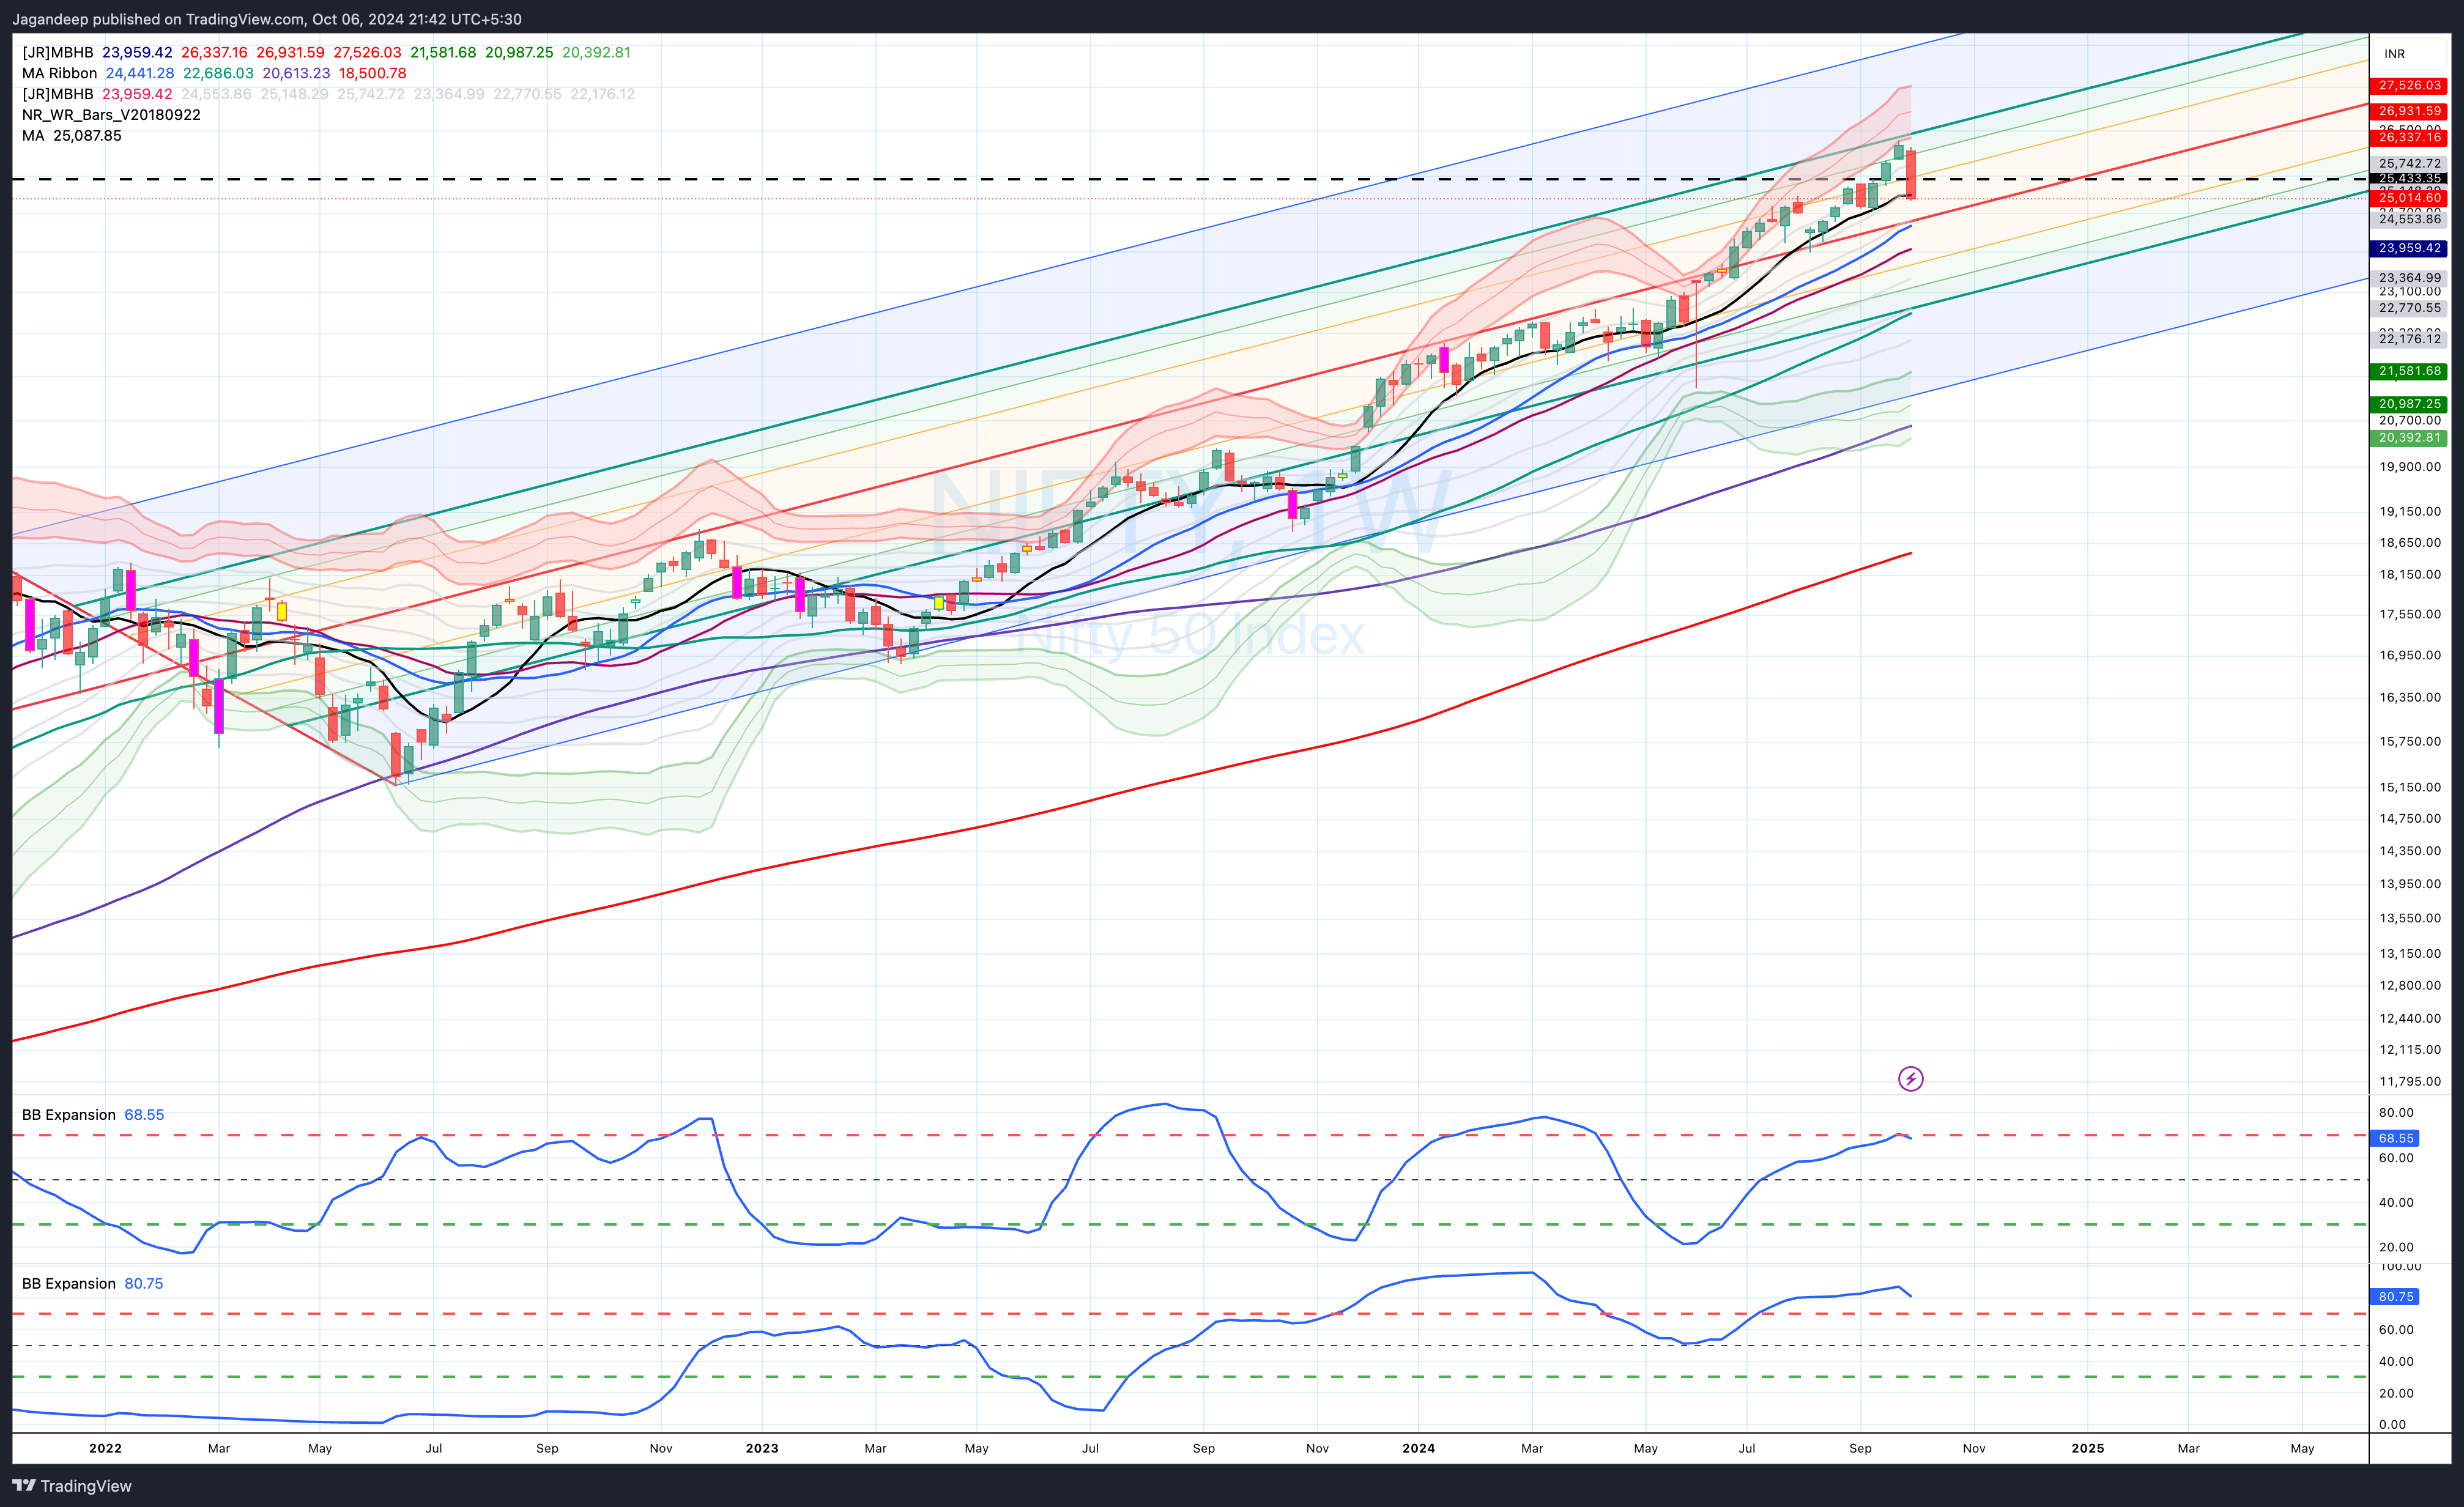
The 26-week Bollinger Bands have completed their expansion and should now start to consolidate. Any further upmove should now happen with a contracting Bollinger Bands on this time frame. At a minimum, the correction should get near the 24200 - 24700 range, i.e. the range of 26 W-SMA and the +0.5 SD.
The 52-week Bollinger Bands is still expanding, and there is a good chance this will continue to develop further.
The chart below shows the 26 W Bollinger Band in the main window and in the first section. The finals section has the indicator for the 52 W Bollinger Band.
Moving Average Analysis
A couple of points are problematic here.
The NIFTY has now spent 48 weeks above the 20 W-SMA. This is the 6th longest streak in history, with most of the longest streaks ending between 55 - 65 weeks. The 26 W-SMA is currently at approx. 24K.
The 13 W-SMA has been above the 26 W-SMA for 70 weeks now. This is the fourth-longest streak in history. The longer streaks are 79 weeks, 80 weeks, and 94 weeks.
This move is starting to get very long in the tooth!!
Thankfully, the momentum indicators of MADI-Z, PVMO, and NTW-MACD have not become problematic but are starting to show divergences. Just take a look at how the momentum indicators have all made lower tops while the prices have moved up.
Updated from prev. 2 Posts - The Impending and Overdue Correction
The “Overdue” nature of these corrections is now getting worse:
79 weeks since the last 10% correction ended. The only longer streak is 86 weeks.
117 weeks since the last 15% correction ended. The only longer streak is 197 weeks.
224 weeks since the last 20% correction ended. This is a record.
227 weeks since the last 25% correction ended. This is also a record.
The larger Time Frames - Monthly
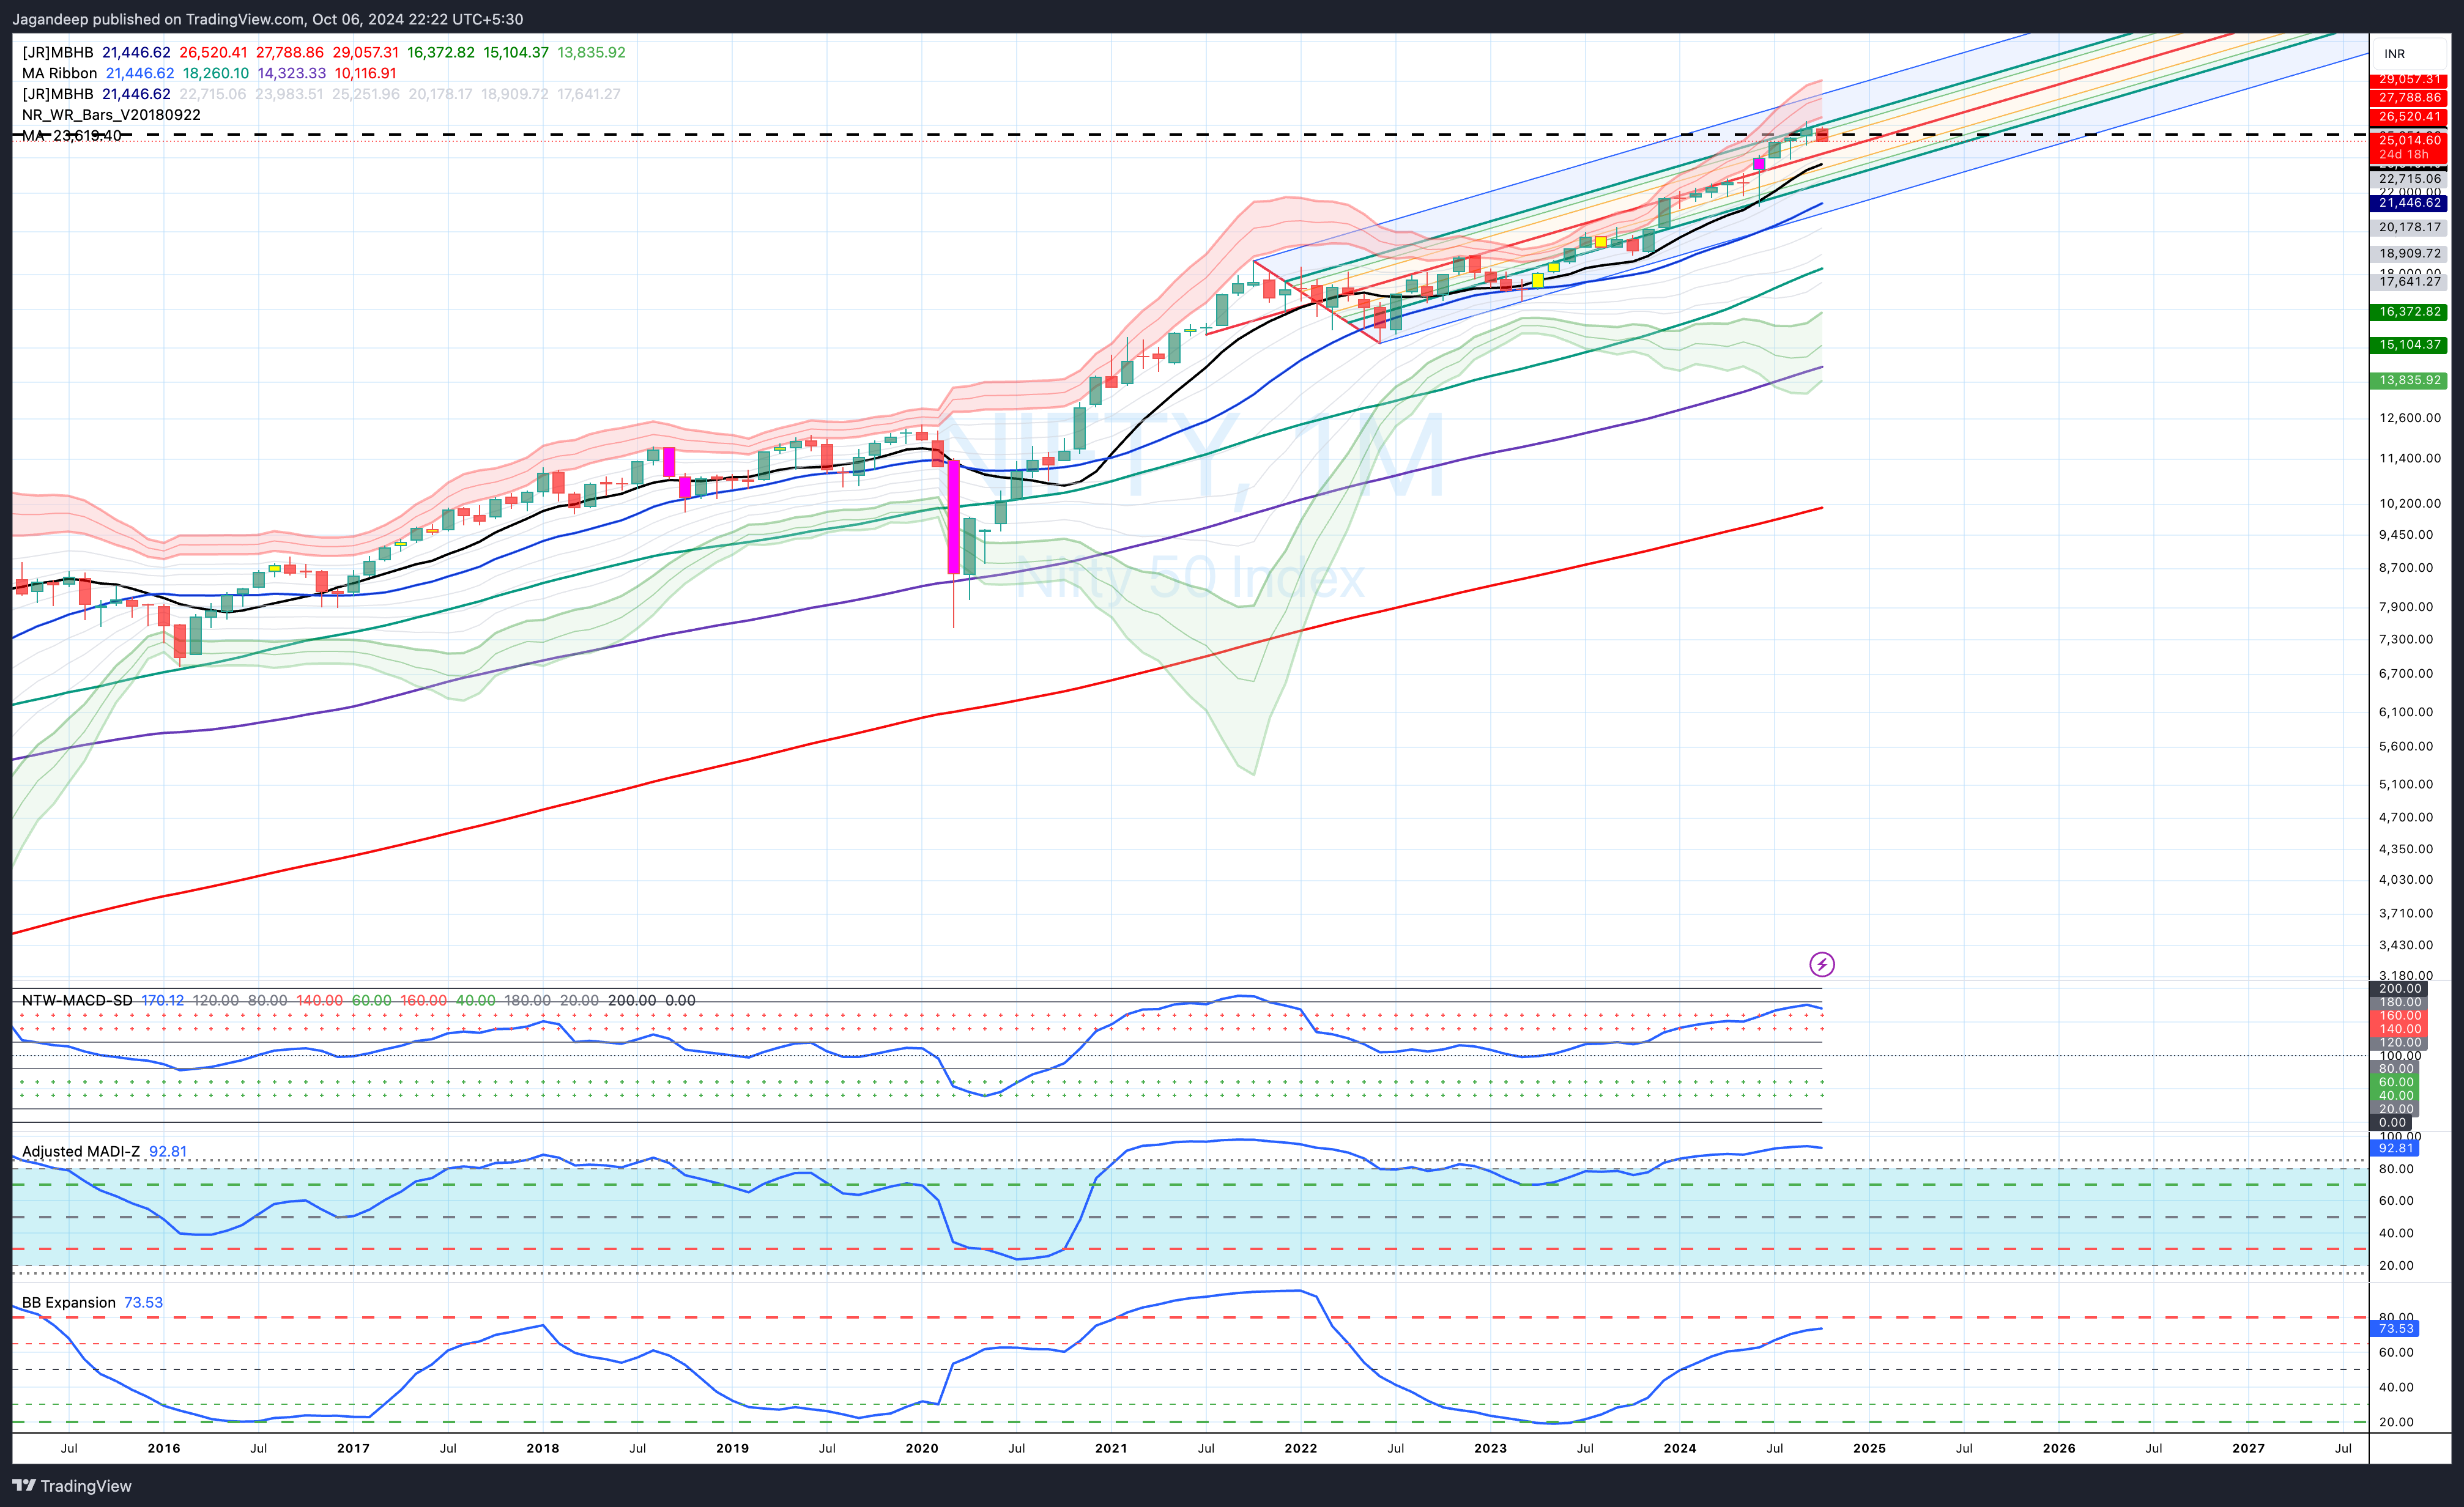
In the monthly time frames, the NIFTY is still fine. The momentum indicators are just starting to reach near extremes and can continue further. Refer to the chart below.
We are still in early October, but there is a good chance that the streak of 11 consecutive higher highs on the monthly chart will also break in October. Refer below for the extract from my last post, “Marching to the Beat into the Valley of Death.”
This is just one example of how things can go, whenever this streak of higher highs breaks.
September will - most likely - be the 11th consecutive Higher High on the Monthly charts. The only higher streaks have been
11 months in 2015 - 16
12 months in 2005 - 06
13 months in 2017 - 18
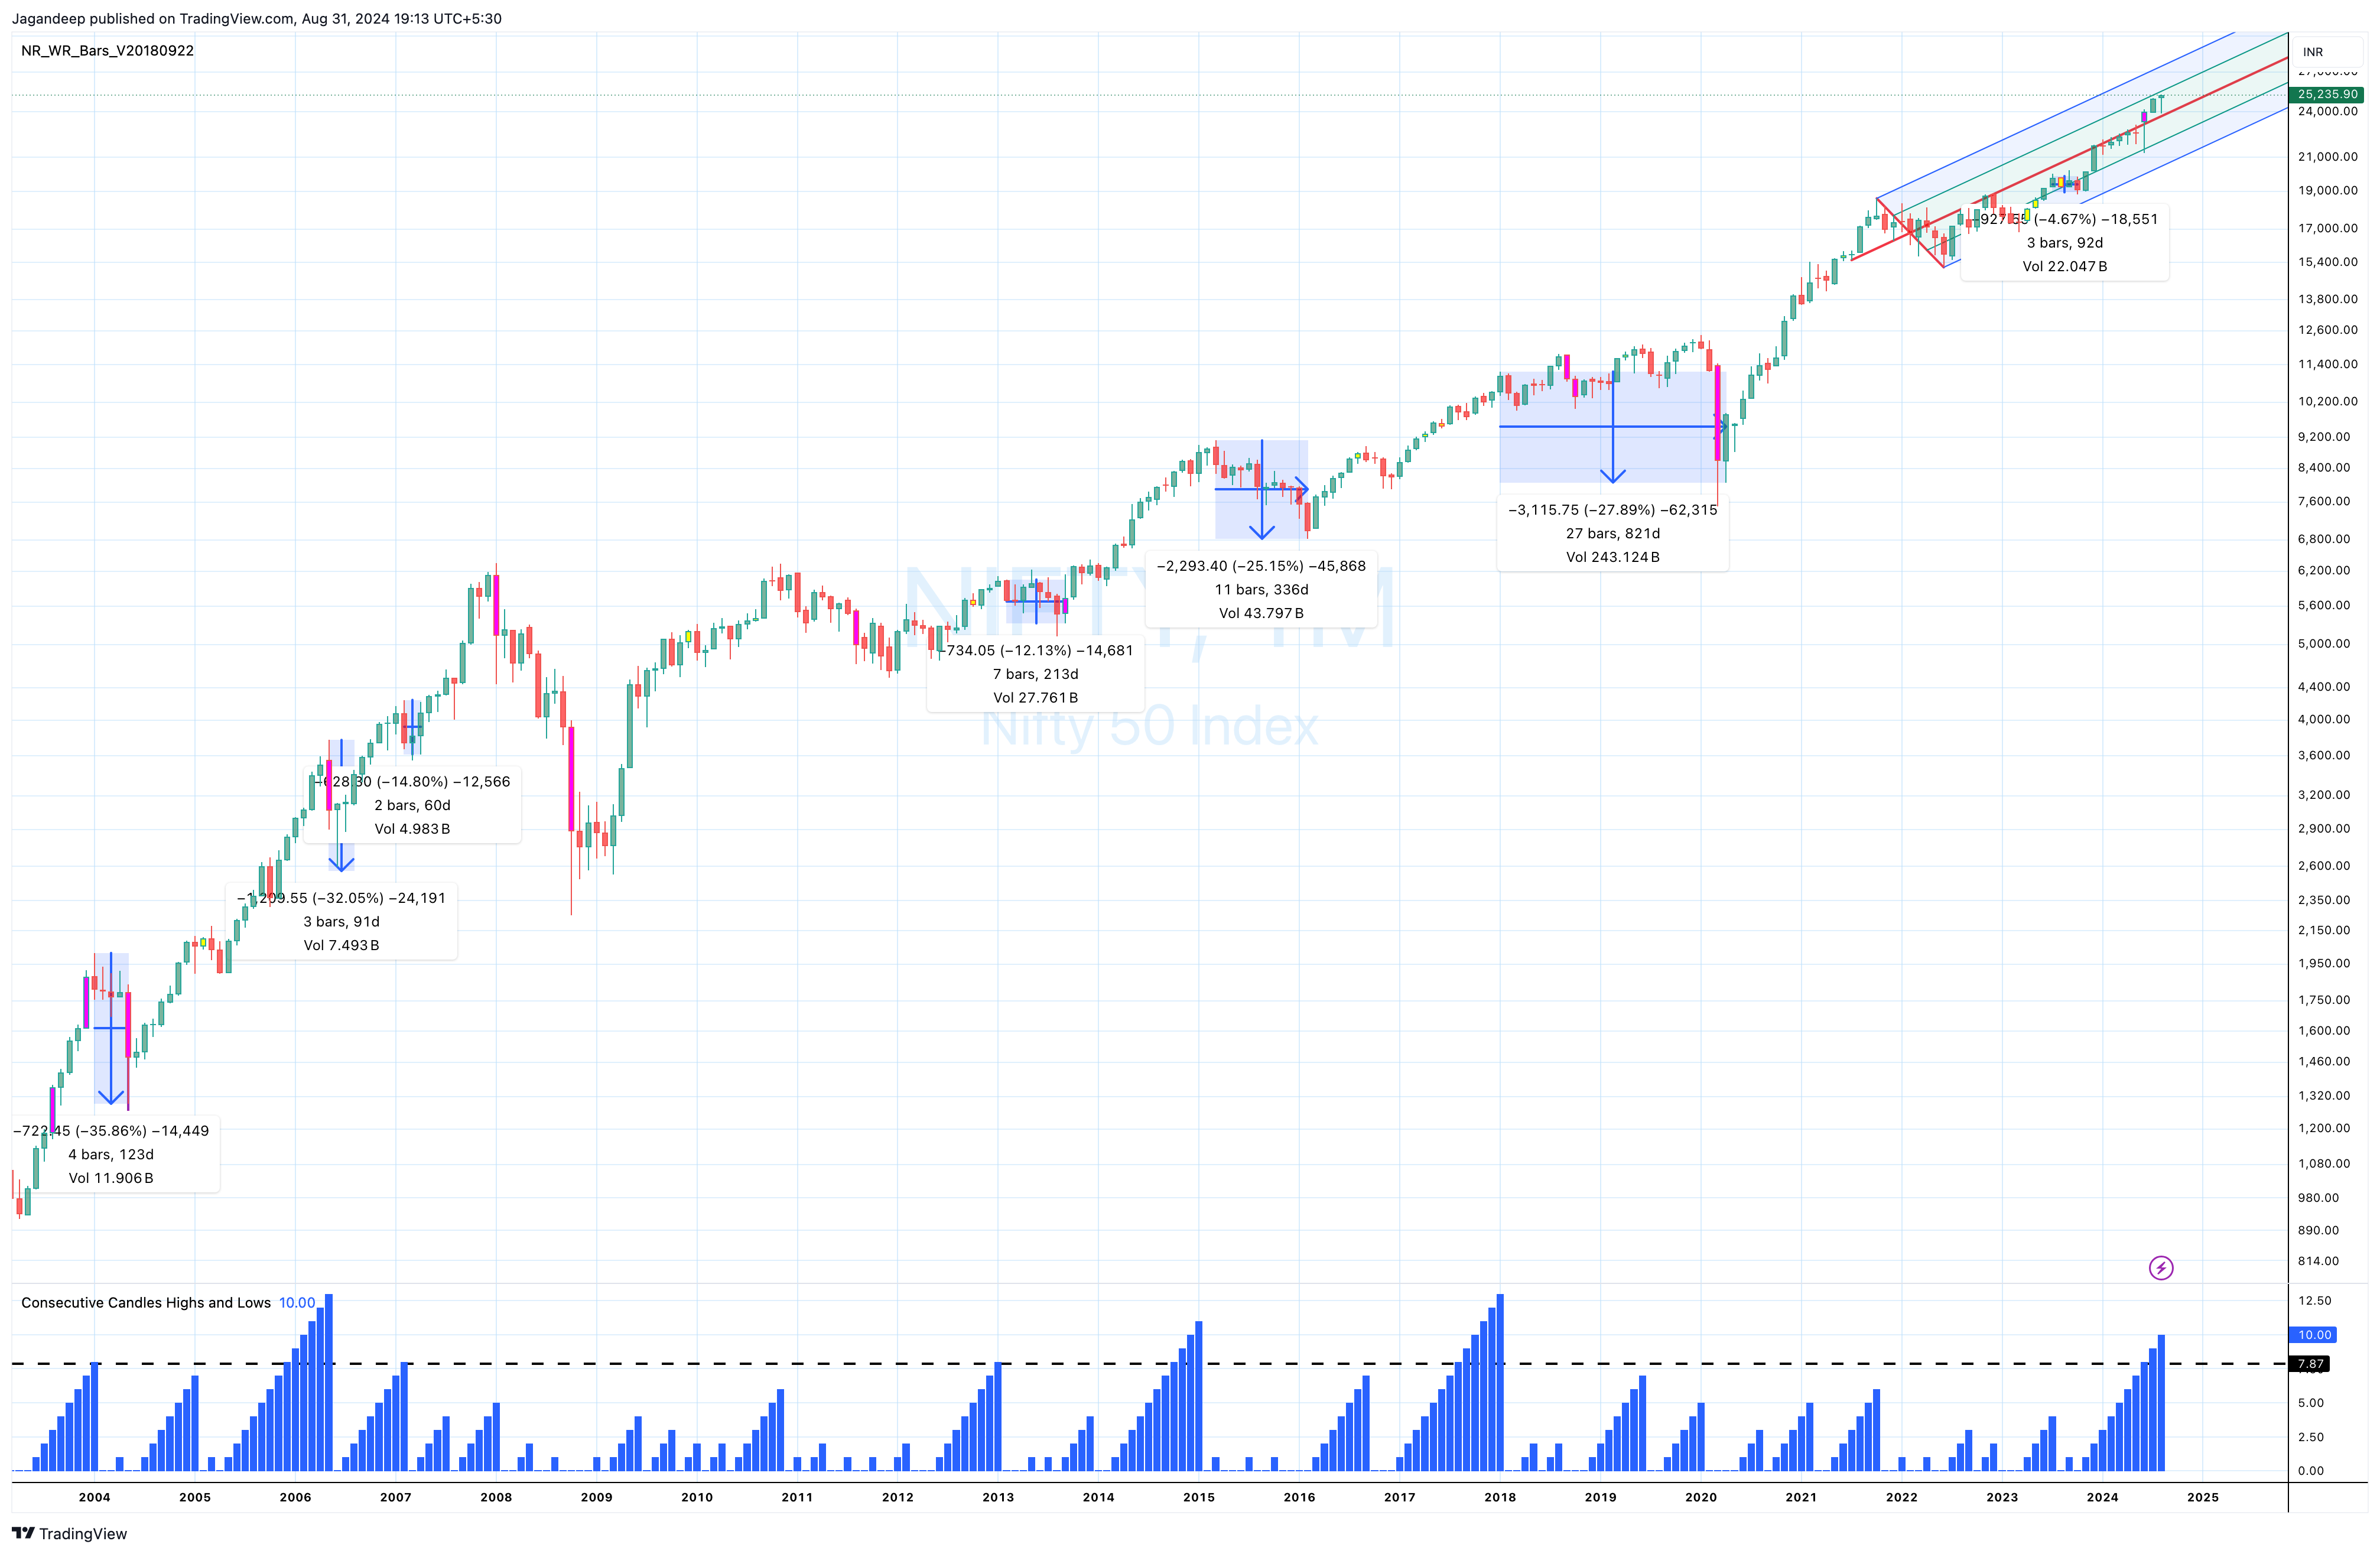
Now, if we step back and look at what happened in prior instances where the NIFTY had a streak of >=8 months with consecutive higher highs, then this is the data
2018 was followed by a 30-month consolidation that ended with a 30%+ correction in March 2020.
A 30%+ correction followed the 2006 streak in two months.
The 2015-16 streak was followed by a 26% fall over 12+ months.
The three instances with streaks of 8 consecutive higher highs all had follow-up corrections of between 12.2% and 14.8%
Chart for reference. We’ll be lucky to escape with a 12%ish correction.
Conclusions of the Analysis
The NIFTY targets are done for this rally (25500 - 27000), and we ended up with a current high of 26277 (right in the middle of the range)
Most Likely
This NIFTY correction should take support in the range of 24450 - 24700 (and in a worst-case scenario near 24K)
The next upmove will not be easy, and there is a very good chance that the NIFTY sees either a double-top or a momentum-less newer high. This doesn't mean that the NIFTY can’t get into the 27Ks or even the 28Ks, but that the move will now be easy. Why? This move should happen when the momentum indicators correct.
From a timing perspective, the next upmove should take some time i.e., there is a good chance that the NIFTY takes some time to sort itself out here (allowing moving averages to catch up and play out their reversions).
Less Likely
An upmove that is as fast as this fall and takes out 26277 with significant momentum.
In this market, it is hard to rule something like this out, but it will either need stellar numbers or a major breakthrough in any of the wards (i.e., news).
Least Likely
There is a break below the 26 W-SMA with momentum and a 15% correction here.
The only way I see this happening IF the war between Israel and Iran truly engulfs the Middle East or something other equally bad happens (in terms of a black swan)
The analysis is meant to be foremost a journal of my analysis. Consider it as such and use it for your analysis. I’m not a SEBI-certified market analyst. I also post market analysis on Twitter with the handle @SeldonOnMarkets
Thanks for reading Seldon on Markets! Subscribe for free to receive new posts and support my work.