


18 months and counting .....
How long with this consolidation continue?

Conclusions from the Analysis
Most Likely:
The market continues to move higher, but the major breakout is still awaited and the consolidation contiues on the longer time-frame
The breakout when it happens will most likely be to the upside.
The short-term upside target is in the range of 18K - 18.2K.
This month and quarter ends up in the green, and by end of the quarter the NIFTY either has touched a new ATH, or is in within touching distance of an ATH.
Less Likely:
A significant breakdown below the lows 16.8K.
A minor small dip can’t be ruled, but I’ll be surprised if the breakdown sustains or gathers momentum on the downside.
Least Likely:
A major breakdown below the previous low of 15.2K or even a move to anywhere close to those levels. OR
A runaway rally that breaks the current ATH and moves higher with momentum.
The Analysis Post
I am not going to look at parameters like VIX (because with the introduction of weekly options it is not really very relevant except at extremes) or Volume (in a separate section).
The Breadth
I have created two custom indicators in Trading View where I look at a basket of 40 stocks (mostly the highest Market cap) to determine short-term and medium-term breadth trend.
The breadth indicators as of 31st March 2023 are as follows. This indicatot didn’t make a new low in the last fall to 16800.
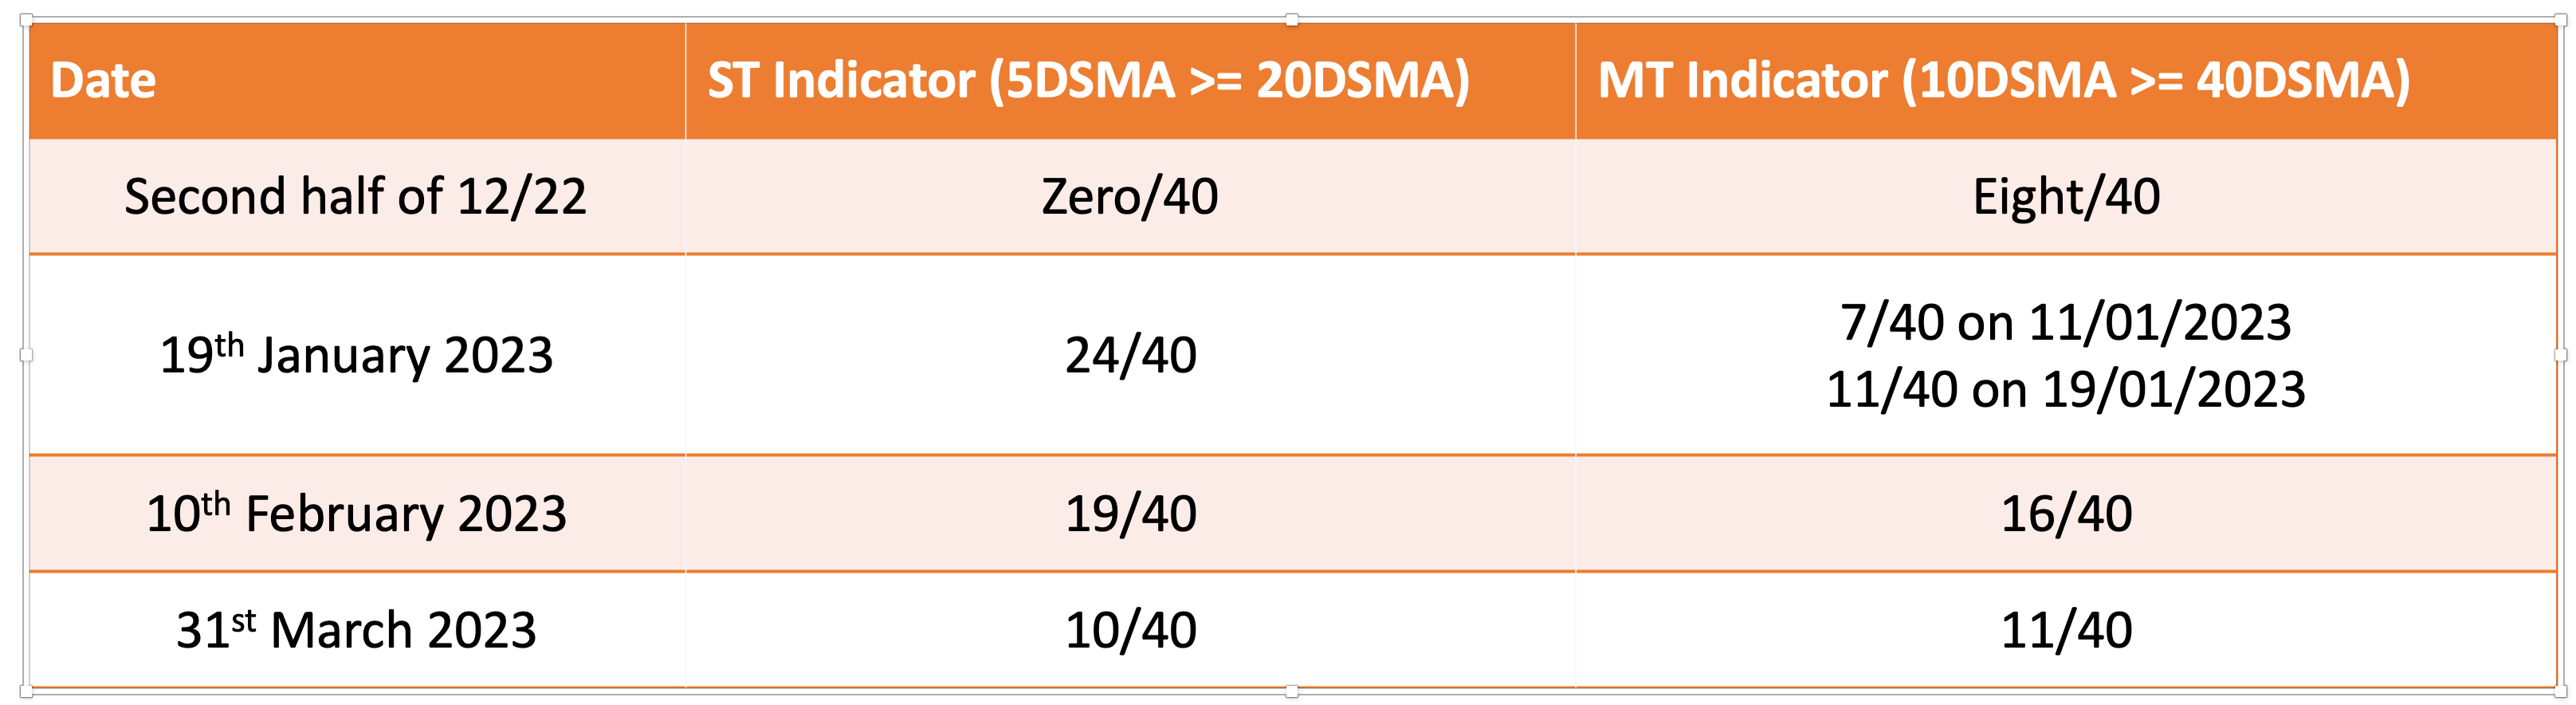
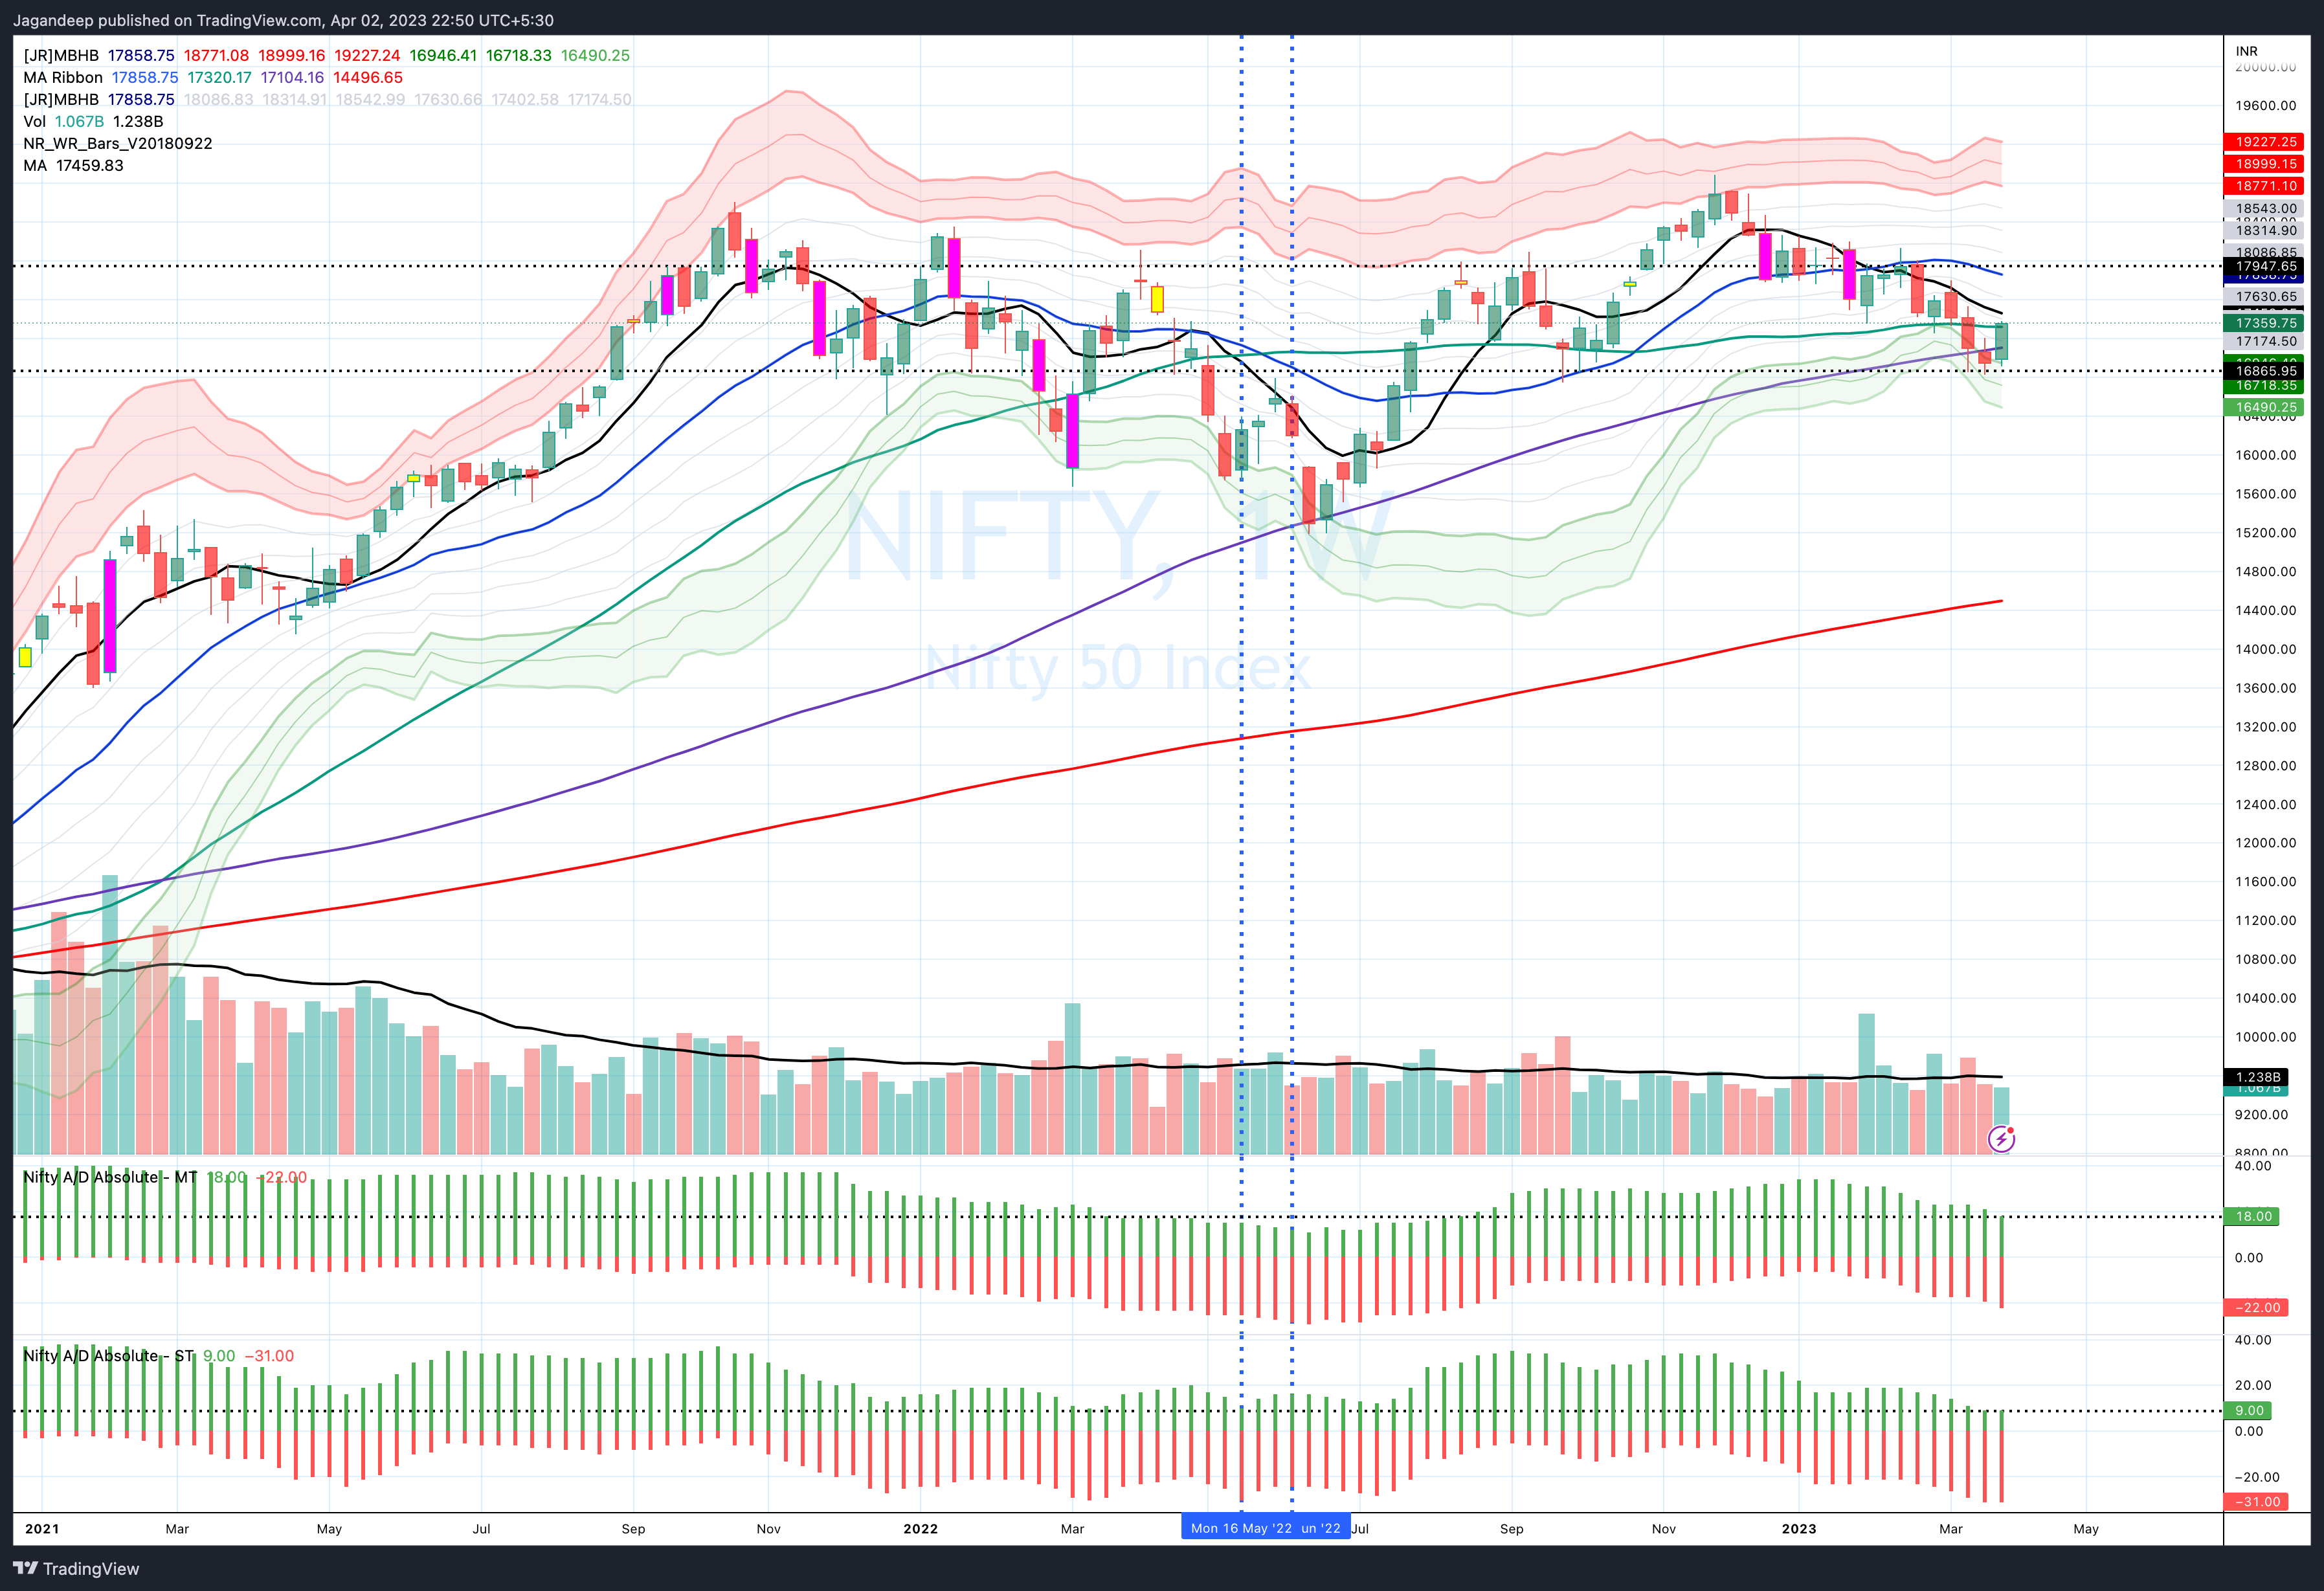
The interesting bit is that the same data has become worse on the weekly time-frame. It is understandable as this has been a major correction on the weekly TF. The ST Weekly breadth indicator has deteriorated wheres the longer-term indicator has come lower but nowhere near as bad as the ST indicator. Refer the chart below
The following is some comparison data from the NIFTY 500
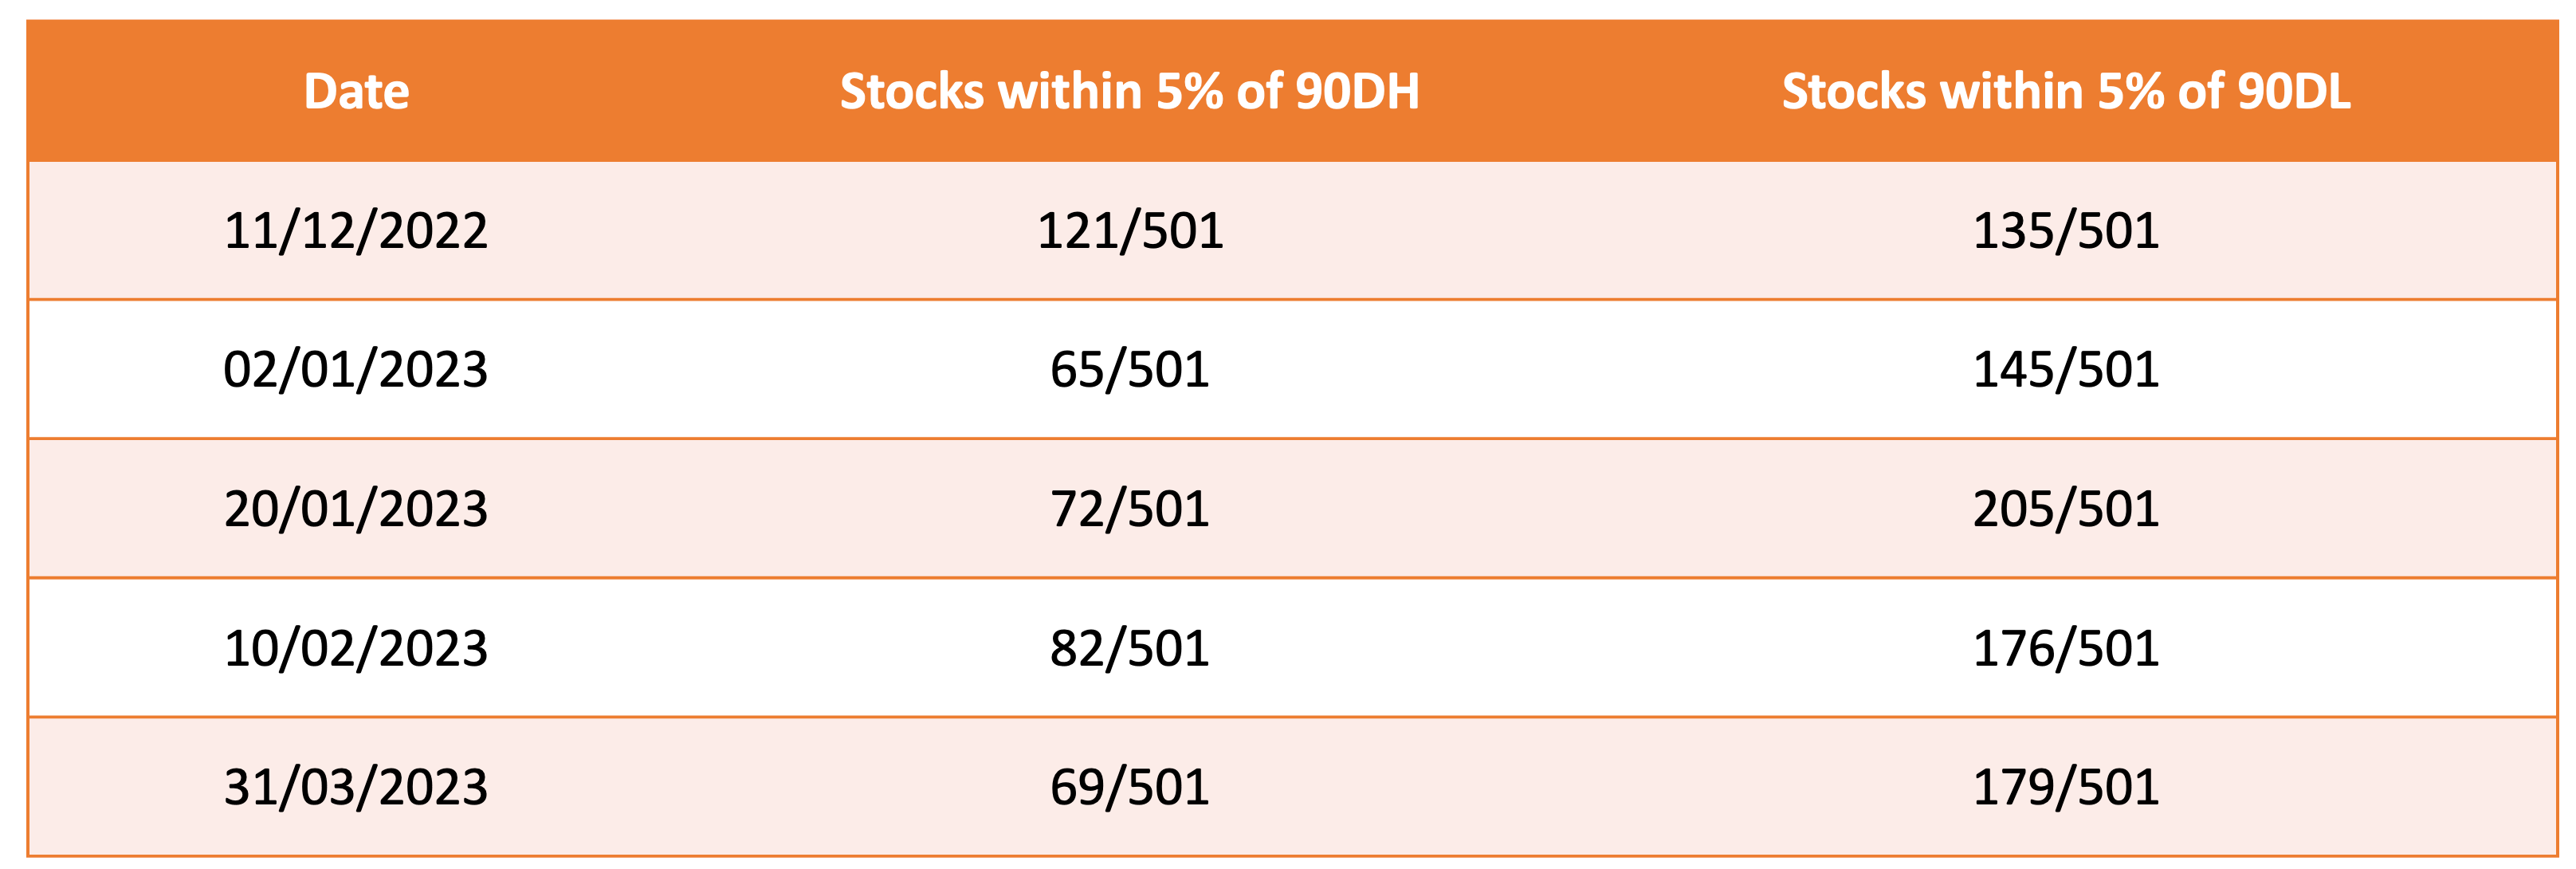
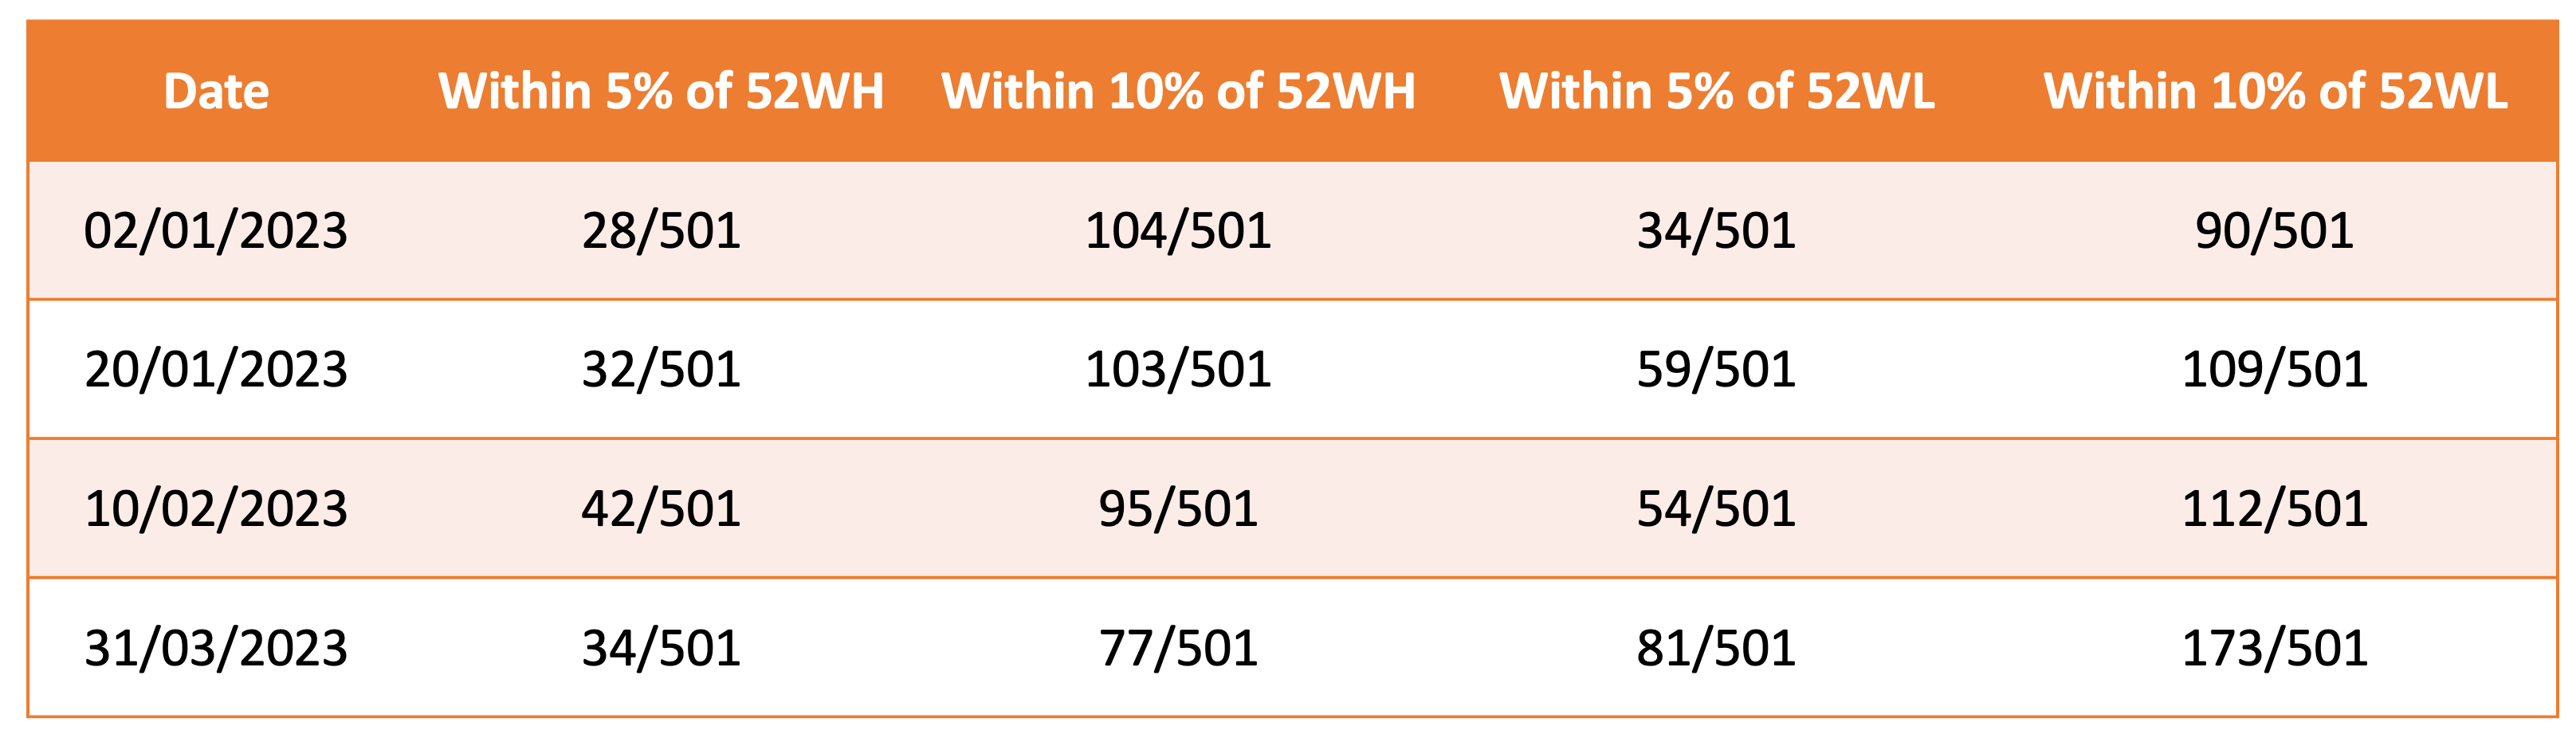
The 90-Day highs and lows are practically unchanged. This could also be because the market has been consolidating and I’m assuming the 90 Day range has become much tighter. The interesting data is on the 52WH and 52WL data:
The stocks within 10% of their 52WL have increased substantially.
The stocks within 5% of their 52WL have also gone up.
The highs data has not deteriorated to an equivalent amount.
If I had to summarize the breadth data then I have to say there is really nothing bad here. The super-bearish sentiment is clearly not reflecting an equivalence in the breadth data.
Do remember that no rally will start with strong breadth. The best rallies start with narrow breadth, but then the breadth builds. As you can see the same has happened on the downside over 3+ months, the NIFTY 500 breadth has become worse. To understand whether any rally is sustainable I’d look for breadth to slowly improve week-on-week.
The Components
CNX - IT
CNX - IT was getting better, (and I was hoping for a breakout in the last post) and then it wasn’t, and then it started getting worse and now we’re back to square one. Everytime it reaches the intermediate top it faces significant selling volume and now it is back at the lows of January 2023. It is now going into the results next week at a makr or break sort of level.
Some observations from the charts below
Since it moved below the 20MSMA, it has continued to sustain around the 8MSMA.
Most major CNX IT corrections have tended to correct to the 50MSMA (around 24.2K)
CNX IT has now sustained below the 20MSMA for 12 consecutive months.
This is now the 4th longest streak in history (without a retest of the 20MSMA).
Previous instances were 25 months in 2002, 20 months in 2008, and 19 months in 2017.
In each of those instances, the lows were made after 12/25 months in 2002, 17/20 months in 2008 and 12/19 months in 2017.
CNX IT has sometimes taken upto 9 months to break the last low of the bear market, and this month #7 since the last low.
This implies there is still a danger that CNX IT can break the last low during the current quarter.
The quarterly chart has been consolidating between the 20QSMA and the -1 SD.
Except for 2008-09, the CNX IT has nearly always tested the 50QSMA during a major breakdown(around 23.5K).
The quarterly MACD also seems to indicate that the moving averages need to catch up to each other i.e. there is some pending consolidation.
With all the potential bearishness indicated above, is there a bullish scenario? The answer is Yes, and the answer is more consolidation. Much more.
If the last low of 26189 is not broken this quarter then there is a good chance the index will consolidate, and will allow the major Monthly and QUarterly Moving averages to catch up.
CNX IT needs to retest the 20MSMA and anchor around it.
The TD Sequential Indicator (Weekly Charts) has given a C13 buy signal with a target of the current swing high.
Refer the charts below.


The interesting thing aboyt CNX IT is that while CNX IT is substantially above its previous major low, that is primarily due to Infosys whereas TCS has held up much stronger. With the TCS buyback being a likely no-show, what will happen to TCS now?
All of these now seem to be undergoing a Wyckoff accumulation on the Monthly time-frame (translated from the weekly Time frame) and that may result in a significantly longer consolidation. We are reaching the point again where the buyers will be tested to see whether they are still ready to buy at or around the previous lows.


The Bank NIFTY
The Bank NIFTY is a very different story compared to the CNX IT.
Quarterly Charts
Bank NIFTY had an inside quarter in Q1 2023.
This is the 10th instance of an inside candle on the quarterly chart, and
In 2/9 instances the inside candle came either after the low for the bear-market was made (2001 and 2008), OR
In 7/9 instances the breakout happened in the direction of the original trend, and the low or high prior to the inside candle was not broken.
The RSI and MACD on the Quarterly time-frame are doing perfecty fine.
Monthly Charts
The index tested its 20MSMA (almost*) and has since then been tagging the 8MSMA.
The RSI and MACD are doing okay and are well within the levels which can trigger an upside move.
The index has still not closed below the last closing top around 39000 in October 2021.
The index has consolidated at the top of the previous break-out i.e. above 39K.
Weekly Charts
The last correction has happened on much lower than average volume.
It has now tested the 50WSMA and since then the index is consolidating, now, between the 20WSMA and the 8WSMA.
The MACD has potentially completed a correction cycle whereas the RSI is now running into resistance with its MAs.
Daily Charts
The correction happened on extremely poor and below average volume whereas the last move up has seen consistently high volume.
The highest colume has come from HDFC Bank whereas the other major banks like ICICI Bank, Axis Bank and State Bank of India have seen average or above average volume. The volume has been anemic in Kotak Bank and Indusind Bank.
The Bearish Projection:
This is really the point at which the Bank NIFTY has to break below its previous lows to translate its correction from the weekly to the Monthly time-frame. This has to happen within the next 4 to 6 weeks.
The Bullish Projection:
The Bank NIFTY continues to move higher or consolidate over the next few weeks and then translates the daily time frame strength to the weekly time frame.
The TD Sequential Indicator (Tom DeMark) has given a P9 buy with a target in the high 43Ks (Weekly Charts)
Refer the charts below:


The Other Component Indices
CNX Pharma
This one looks quite good, although its probably running into some short-term resistance (Weekly Moving Averages).
The Monthly charts has tested the -2SD and has since moved back up.
The Quarterly MACD cycle has still not completed and a continued up move can ensure this happens.
TD Sequential Indicator from Tom DeMark has given a P9 and C13 buy with targets near the current intermediate high of 13.7K
Expected Scenario:
Can move up potentially in the short-term, but the longer-term time frames indicate consolidation. (FYI. The Quarterly chart seems like its a couple of quarters ahead of CNX IT)


CNX Infrastructure
The Quarterly Time Frame chart is near perfect. Minor consolidation above the 8QSMA.
On the Monthly time frame, the index has tested the 20MSMA and moved back up. The MACD and RSI are also moving in the right direction, and could indicate a potential move higher.
On the Weekly Time-frame the index nearly tested the 100WSMA and since then has moved back up higher. It is running into some minor resistance.
Expected Scenario:
Can consolidate potentially in the short-term, but the longer-term time frames look quite good.


CNX FMCG
Ths is a near perfect trend with some minor conolidation in the short-term. The Quarterly RSI is running up, but it could be multiple quarters before it presents a challenge.
TD Sequential Indicator from Tom DeMark: Has given a P9 sell signal on the Monthly and the Quarterly charts. This is a major note of caution.


CNX Energy
This one looks much more dicey, and that is thanks to the shenanigans associated with the Adani group.
On the Weekly Time Frame, the index looks fairly decent and has started a move up.
Despite that it has *still* not taken out the short-term top from the past few weeks and till that happens there is a good chance this is a flash in the pan.
The price is in the middle of nowhere.
The chart has taken a beating on the Monthly time frame, and will take significant consolidation before it becomes positive.
The RSI is just about okay, whereas the MACD has significant time to go before it completes its positive MA crossover. It will need either siginificant consolidation or some sort of up move.
The price is in the middle of nowhere.
On the Quarterly Time Frame the last quarter was a real disaster.
The one quarter took out the move of the last five quarters.
The RSI looks fine, but the MACD has had a bearish crossover of MAs and has the potential to become ugly.
Expected Scenario:
Bullish Scenario
The Adani fall out is done, and Reliance has taken support at previous lows. The index starts to repair taken forward by Reliance.
Bearish Scenario
Reliance breaks down.


The NIFTY
The NIFTY has been a strange beast. Its now the 19th month since the consolidation started, and it has been a time to remember for the lessons it has taught and one to forget regarding the impact on the portfolios and P&L.
Weekly charts
The correction happened with decent volumes (average to above average) whereas the correction to the correction i.e., the upmove of the past couple of week has happened with lowish volumes.
The RSI is in the range of its Moving Averages and any crossover and sustenance above it would be bullish.
The MACD is at the point of a bullish crossover of its moving averages.
The index has now spent 12 weeks since its last test of the 20WSMA, and in consolidation - correction periods (sort of what has happened in the NIFTY) this tends to end within 12 - 17 weeks.
The index tested its 100WSMA, and went to nearly -3 SD.
The low was in the exact week when the TD Sequential Indicator by Tom De Mark gave a buy on the NIFTY with a target near 18200. (Refer chart below)
The NIFTY has made a “potential” double-bottom with its September 2022 lows.
All of the above indicates a pullback to the upside (atleast) and that is underway as we speak.


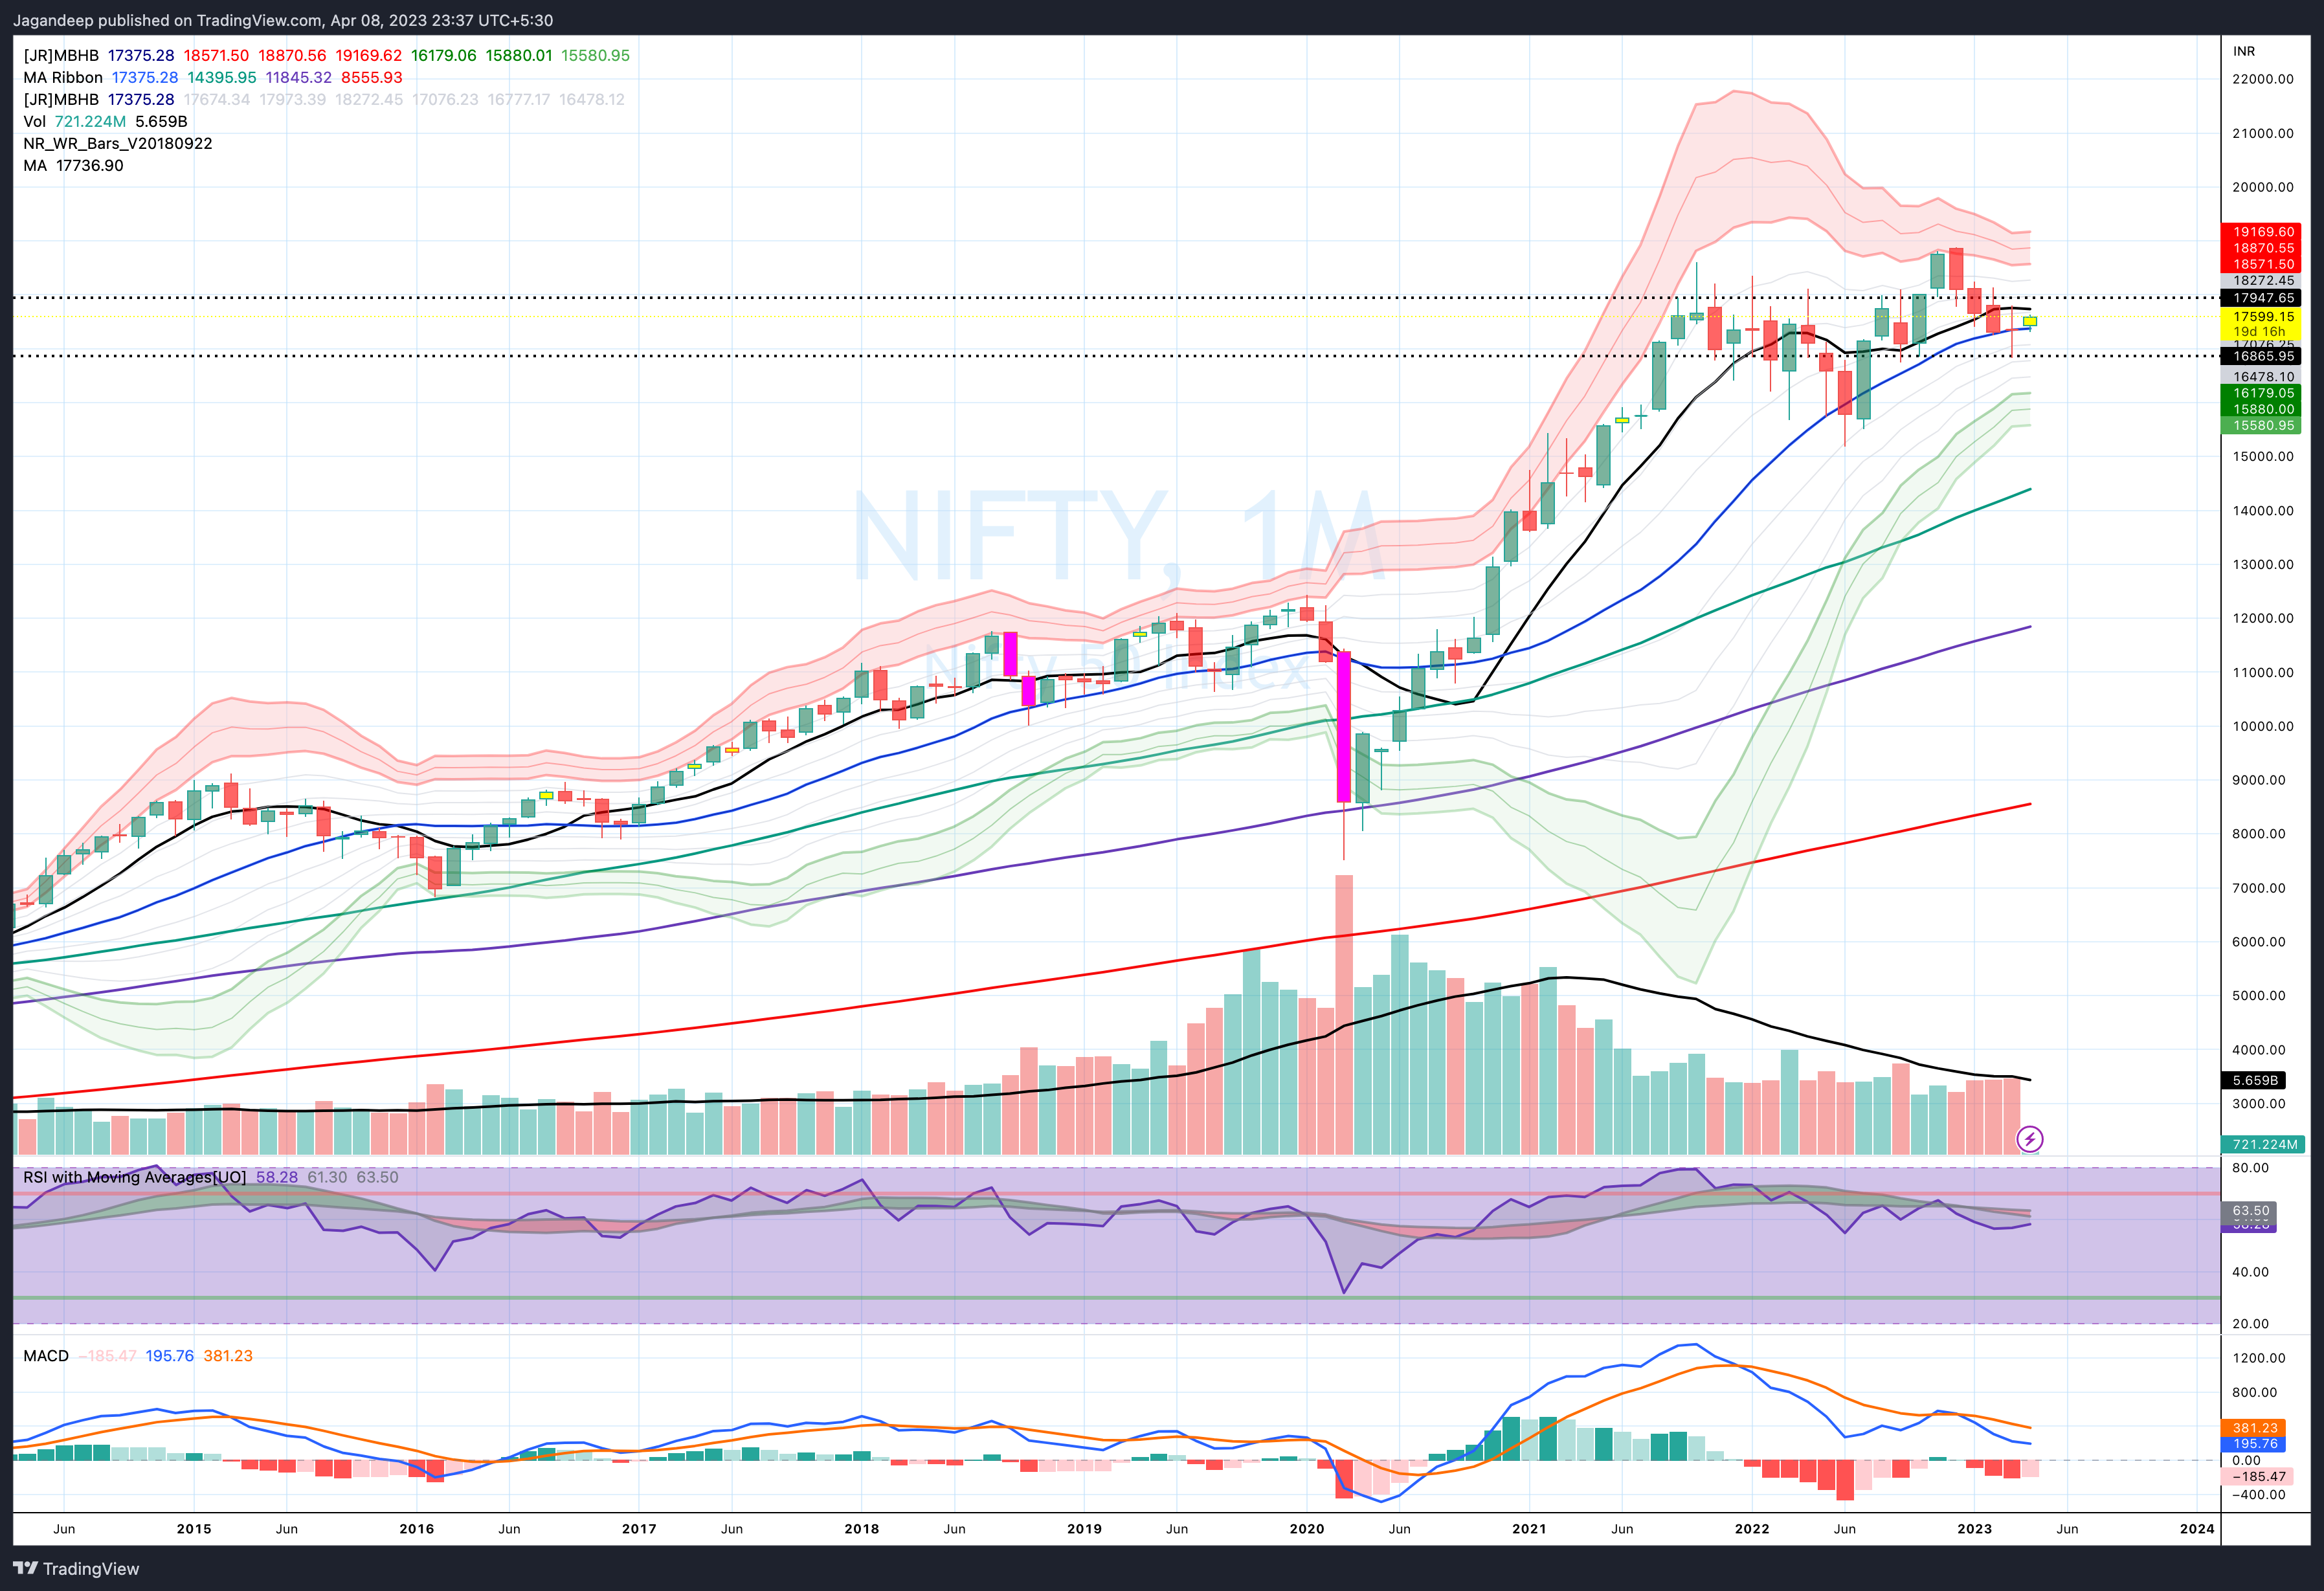
Monthly Charts
It is now the 3rd month when, the NIFTY has consolidated between the 8MSMA and the 20MSMA. Historically this sort of consolidation has lasted between 3 to 5 months.
The NIFTY made 4 conseutive red candles on this time frame. This is the 5th instance.
There have never been five consecutive red candles (since 1997).
In 3/4 instaces this pattern resulted in major multi-month rallies ( 6 to 18 months)
In one instance the NIFTY broke the current short-term low by 2% and then one quarter later launched into a freocious multi-moth rally.
March 2023 looks eerily similar to December 2016. (Price - RSI - Context)
Some further pullback to the upside will also lead to a positive crossover in the MACD.
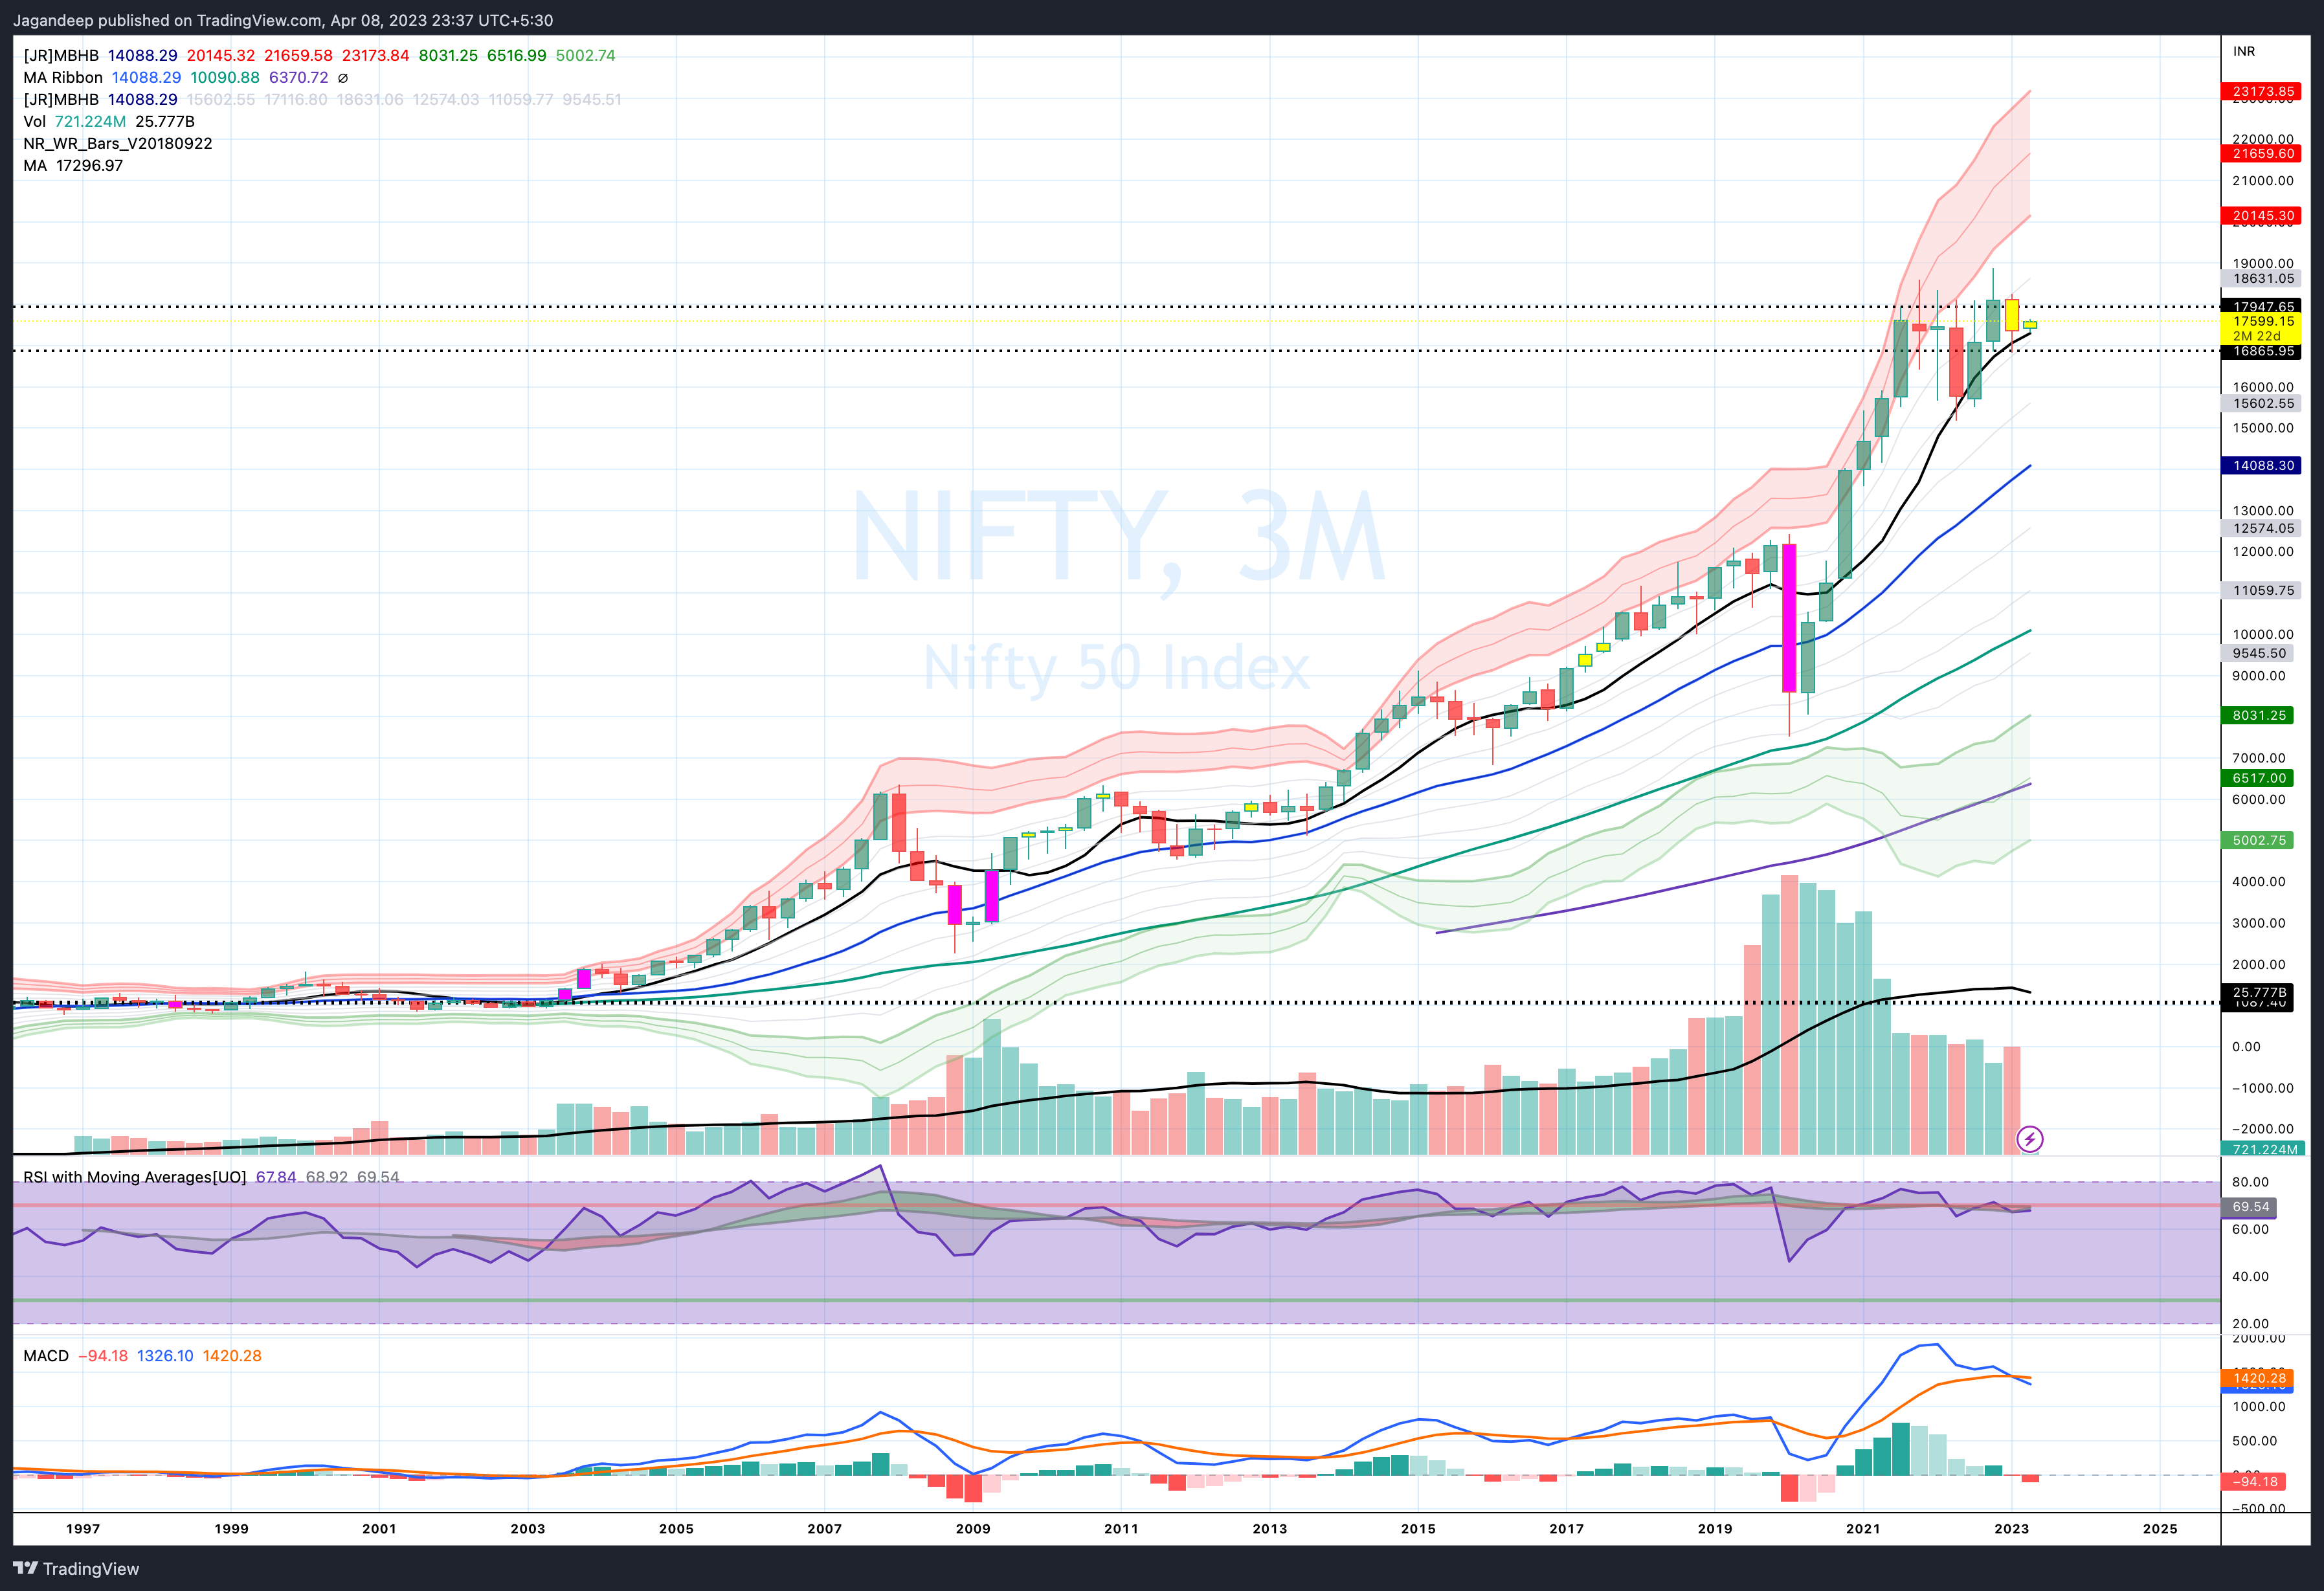
Quarterly charts
Nothing to complain here at all.
The index is consolidating above the 8QSMA.
The RSI is consolidating around 70.
The MACD has seen a negative MA crossover, but nothing that one positive quarter can’t rectify.
The price action in Q1 2023 was eerily similar to the price action in Q4 2016.
Monthly and Quarterly Charts below:
Summary
The Breadth has been hanging steady in the shorter-term as well as the longer-term.
The Components
CNX IT is looking iffy at the moment, and is at a make or break sort of level. History suggests there is a good chance of a further potential downside, whereas there are positive indicators aligning in the short-term.
Bank NIFTY has taken the hit like a champ, and looks okay at this time. Longer-term charts have not seen any real damage.
CNX Pharma is looking good for a short-term and medium-term rally.
CNX Infrastructure could be a potential leader in any rally along with the Bank NIFTY.
CNX Energy has taken a major hit due to the Adanis and the poor price action from RIL. Will need Reliance to help repair this index.
CNX FMCG looks great, but the TD Sequential indicator is flashing yellow on the longer time frame charts.
The NIFTY
The Short term rally was expected and warranted.
The short-term still looks uncertain but the medium term to long-term charts are shaping up quite well.
If this was a correction limited to the Weekly time frame then this there is a ood chance that it should be over now, but any further sustained weakness could imply a multi-month downside potential because it can impact the Monthly charts.
Post Script
None of the above should be considered financial advice. I am not a registered advisor.
Please feel free to use the analysis as you see fit in your investment thesis.
I post updates to my analysis on
Twitter: @SeldonOnMarkets
Post: https://post.news/jagandeep
Mastodon: @SeldonOnMarkets@econtwitter.net
Thanks for reading Seldon on Markets! Subscribe for free to receive new posts.
What indicator is displaying the P9 C13? Thanks for the great post